
BIANA
BIANA: Biologic Interaction and Network Analysis
BIANA Tutorial
Contents
1 Getting Started1.1 Starting BIANA
1.2 Creating a new BIANA Database
1.3 Parsing External Databases
1.4 Creating my first working session (without data unification)
1.5 Creating a Unification Protocol
1.6 Creating a working session using a Unification Protocol
1.7 Creating unification protocols with rules having multiple attributes
1.8 Creating my first network
1.9 Creating different kind of networks
1.9.1 Different ways of network representation
1.9.2 Creating a network of attributes
1.9.3 Making predictions: Expanding relationships between nodes sharing one or more attributes
1.10 Removing Unification Protocols
1.11 Removing BIANA Databases
2 Working with Multiple Data Sets
2.1 Generate different datasets with initial sets of biomolecules of interest
2.2 Union and intersection of different data sets
2.3 Selecting a subset of entities by having some attributes or tags
2.4 Selecting a subset of entities from an existing set
2.5 Tagging biomolecules using different criteria
3 Handling Indirect Biological Relations
4 Introducing User Defined Data
4.1 Introducing a user specific database
4.2 Create a network using your own data
5 Generating and Using Sequence Similarity Information
5.1 Calculating similarity of non redundant sequences in the BIANA Database
5.1.1 Removing sequence redundancy in the BIANA Database
5.1.2 Calculating sequence similarities in BIANA Database
5.2 Making predictions using sequence similarity: Sequence interologs
6 Putting It All Together
6.1 Creating a comprehensive BIANA database and an extensive unification protocol
6.2 Analysis on the mouse interactome
6.3 Analysis on the specie-wide interactome
6.4 Analysis on the homology extended interactome
Preface
Prerequisites
This tutorial assumes that you have properly installed BIANA Cytoscape Plugin. For BIANA download and installation please refer to http://sbi.imim.es or to the BIANA reference manual.If you are using BIANA only for testing purposes, you can skip the MySQL server installation and the database creation and unification, because we provide a database in our server to be used for those tests. Check in the section *. Data files needed for following this tutorial can be downloaded from http://sbi.imim.es/web/BIANA.php?page=biana.documentation. It is also found in the directory {biana/doc/tutorial}.
Intended Audience
Users without previous BIANA experience. Users are expected to have basic knowledge on biological databases, protein protein interactions.Aims
The tutorial aims to introduce basic acquaintance on BIANA usage.Organization
This document is divided into 5 chapters, each of which demonstrates distinct capabilities of BIANA through simple examples. In the first chapter (Chapter 1), we introduce how to use BIANA Cytoscape Plugin for creating sets of proteins if interest and their networks. Then, in Chapter 2, we will go over some common operations provided by BIANA to manage multiple data sets. Next, Chapter 3, shows how BIANA could benefit in the biological analysis of certain biological relations for a particular case, PTGS2. Following that chapter, Chapter 4 explains basics of inserting user provided data. Finally, homology based interology network creation will be elaborated in Chapter 5.Introductory Concepts
- External Database
- Data source that contains biologic or chemical data parsed by BIANA. Examples include UniProt, IntAct, Reactome, Kegg, Pfam...
- External Entity
- Entries given in External Databases.
- BIANA Database
- Main data repository of BIANA storing biological/chemical information parsed from various External Databases.
- Unification Protocol
- Set of rules that determine equivalence of data in various data sources (to cross data spread over distinct external databases).
- User Entity
- Set of External Entitys that are decided to be "equivalent" with respect to a given Unification Protocol.
- User Entity Set
- A group of User Entities.
Testing BIANA Tutorial Database
You can access the online BIANA database for testing purposes. It allows skipping the installation step of installing a MySQL server and the initial steps of database creation and population. However, the online BIANA database has the following limitations:- It has only READ permissions.
- New databases, parse new data or create unification protocols are not allowed. If user tries to execute some of these operations, an exception will occur.
- It is a reduced database, which only contains necessary data to execute the tutorial exercises.
- User: biana_user
- Password: biana_password
- Database server: sbi.imim.es
- Database Name: online_bianaDB
- UniProt-SwissProt database
- Gene Ontology (GO)
- NCBI Taxonomy database
- PSI-MI ontology
- IntAct database
- MINT database
- Reactome
- Tutorial databases (theoretical example)
- SBI datasets:
- Inferred Metabolic Network
- Transcription Factor cooperation and Regulated genes
- Protein-protein interaction network predicted from sequences/structure distant patterns
Chapter 1
Getting Started: Preparing and Executing BIANA for a Typical Analysis Session
Under the context of this chapter, you will familiarize you with the basic usage of BIANA, building a BIANA data repository, defining equivalence of data in the database (Unification Protocol), creating sets of proteins of interest and constructing their networks.
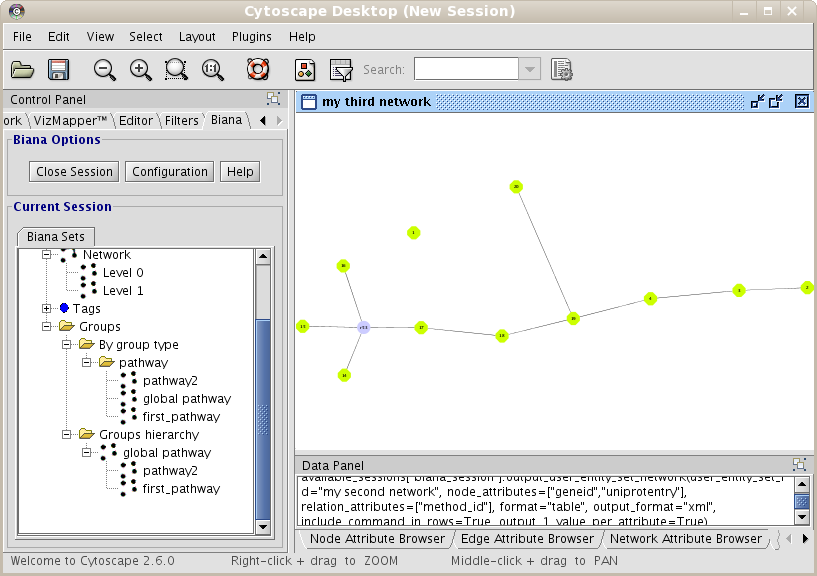
1.1 Starting BIANA
From the Cytoscape menus at the top, go to Plugins and then click on BIANA as demonstrated in Fig 1.1.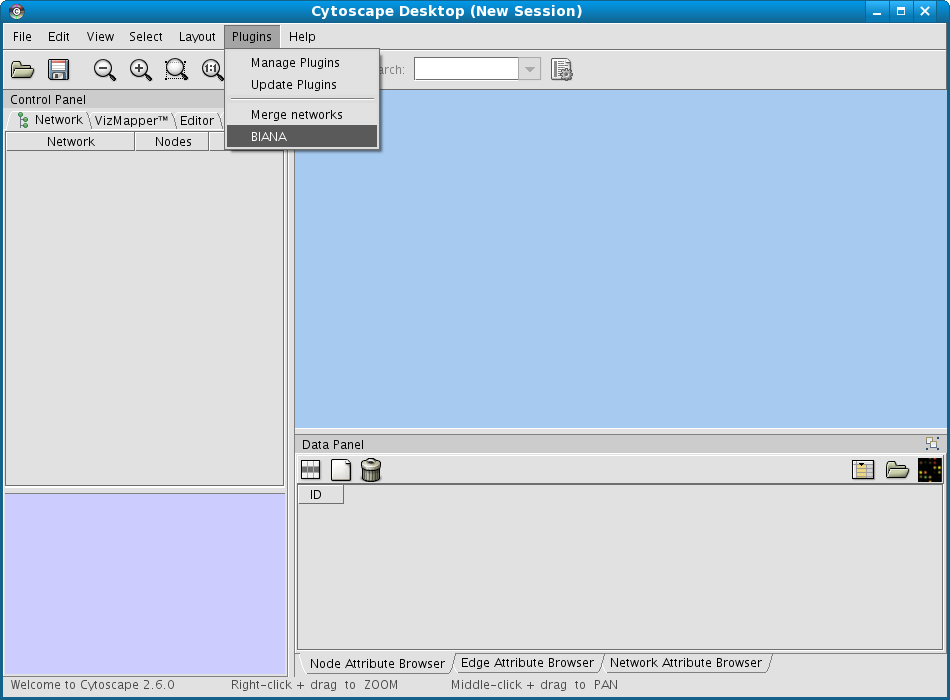
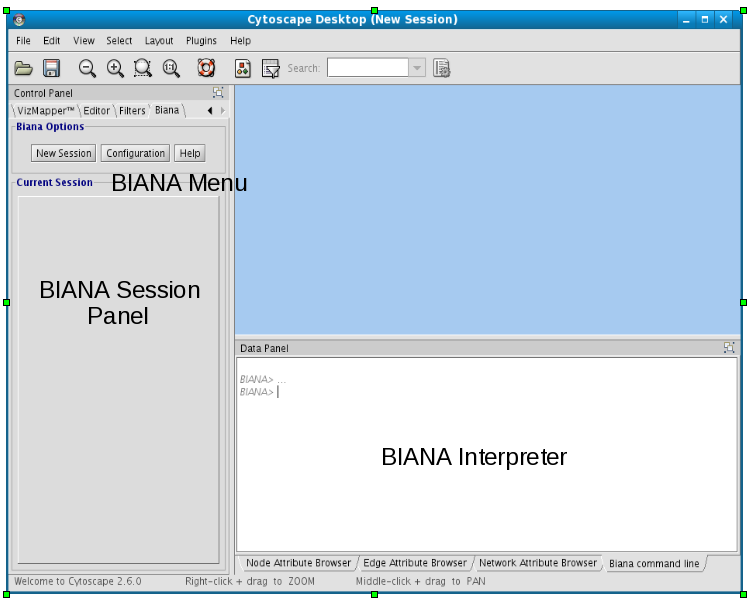
- Inside left Cytoscape panel:
- BIANA Menu:
- Main BIANA menu buttons.
- BIANA Session Panel:
- When a working session is started, all working elements can be accessed in this panel.
- Inside bottom Cytoscape panel:
- BIANA Interpreter:
- Python interpreter where you can execute manually all BIANA commands and see how the graphical interface generates them.
1.2 Creating a new BIANA Database
If you are running BIANA for the first time, the first thing to do is to create an empty BIANA Database. This MySQL database is going to be used to store all the data that is going to be parsed from External Databases later on.If you are using our online BIANA Database for testing purposes, you must skip this section, as you don't have database creation permissions. You must execute the option Add existing BIANA Database with the parameters described at *. Then, skip this section.
To create a new BIANA Database
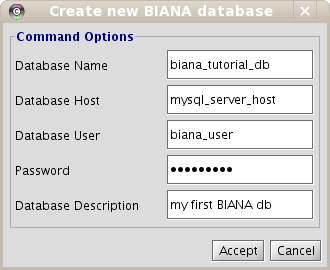
- Click on Configuration menu at the top of the BIANA panel on the left side of the Cytoscape.
- Click on Create new BIANA Database.
- In the pop-up window (Fig 1.3), enter database details.
- Click on Accept.
| boxbackground |
Remember, you have to use your MySQL server host and your MySQL configuration parameters: user and password. If you don't know how to manage it, take a look at www.mysql.com or ask your system administrator. Also, you can have your MySQL Server in your own machine or in a remote machine. If it is in your local machine, you can put as host "localhost" or "127.0.0.1" (not in all machines work both).
1.3 Parsing External Databases
Once a new BIANA Database is created, it only contains the structure of the database, but it is completely empty. So, you need to insert data available in various data sources (External Databases) into this database. See the BIANA manual to check which external databases and/or generic file formats are supported by BIANA. If you are using our test BIANA Database for testing purposes, you must skip this section (online database BIANA user account does not have permissions to insert data in our database server).Usually, external databases contain biologic entities (as proteins, genes, etc.) and relations (as interactions, pathways, etc.) between them. Our examples contain following types of information:
- input_database1.txt: Contains a list of proteins and genes, with different types of identifiers for them (UniprotEntry, TaxonomyID, GeneID, AccessionNumber and GeneSymbol).
- input_database2.txt: Contains a list of proteins identified by their UniprotEntry code specifying which PFAM domains they contain.
- input_database3.txt: Contains a list of proteins identified by their NCBI AccessionNumber specifying their TaxonomyID and sequence.
- input_database4.txt: Contains a list of genes identified by their GeneID codes, and a list of interactions between them.
- Click on Configuration menu.
- Click on Parse External Database.
- In the pop-up window (Fig 1.4), enter the details of the data source going to be parsed, parser type and folder or files the data is provided (Under the context of this tutorial, you will parse the 4 hypothetical databases containing various kind of information):
- Select the BIANA Database you have just created to insert the External Database.
- Select the type of the External Database format as "Generic Parser".
- Choose the path of the External Database file as
"tutorial/data/theoretical_example/input_database1.txt". - Put a name and version for the External Database that is going to be used to identify this External Database inside BIANA such as "database 1" and "version 1".
- Choose default attribute type of the current External Database. Select "uniprotentry" for databases 1 and 2, "accessionnumber" for database 3 and "geneid" for database 4.
- Click Execute button.
- Parser will start automatically, and it will appear in the table at the bottom of the window. You can follow the status of the current parsing process in the same table. You can check parser outputs by clicking twice on that table row. Repeat the same process for each External Database. It is not necessary to wait previous parsing processes to finish. They are added into a queue and executed consecutively.
- Once all 4 External Databases have been inserted, close the window.
- Click on Configuration menu.
- Click on Update available BIANA databases in order to update the information recently added.

| boxbackground |
BIANA offers by default several parsers to be able to insert most common databases. Most parsers do not have a default attribute selection option, as they know for each database which is the primary identifier. However, in data standard based parsers such as "generic", "biopax_level_2" or "psi_mi_2.5", as the default identifiers differ between different databases, you have to specify them manually.
| boxbackground |
BIANA offers insertion of an External Database as promiscuous. If a database is specified as promiscuous using the checkbox in parser option window, the entries coming from this database will be treated differently during data unification. Entries coming from promiscuous databases, when unified, can belong to multiple User Entities if they satisfy the equivalence conditions (imposed by the unification protocol) with any non-promiscuous entry belonging to the same set. A useful example of a promiscuous database is SCOP, database of protein structural domains, where a domain can be assigned to more than one protein (User Entity in our analogy). See BIANA Manual for more information about a schematic explanation of promiscuity.
| boxbackground |
If you close Cytoscape before all parsers have finished, the process inserting the current External Database will continue until it finishes, but not the rest! So, it is not recommended to close Cytoscape before all External Databases have been inserted!
1.4 Creating my first working session (without data unification)
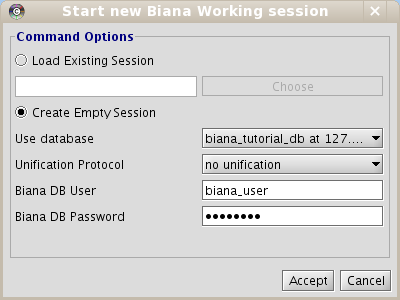
Once you have populated your BIANA Database, to start working with BIANA, you must create a BIANA Session explained below. A BIANA session is a container for all user generated sets of biomolecules and their networks. All query/data retrieval operations are going to be handled over this session using a BIANA Database created previously.- Click on New Session menu button at the top of the BIANA panel on the left side of the Cytoscape.
- In the pop-up window, Select Create empty session option (Fig 1.5).
- Select your BIANA Database(If you are using our online test BIANA Database, you must select it).
- Select your Unification protocol. As you have not created any unification protocol, you will only be able to select No unification. If you are using our online test BIANA Database, select the Unification Protocoltutorial_exercise1_no_unification)
- Add your MySQL Server access permissions for selected BIANA Database if necessary.
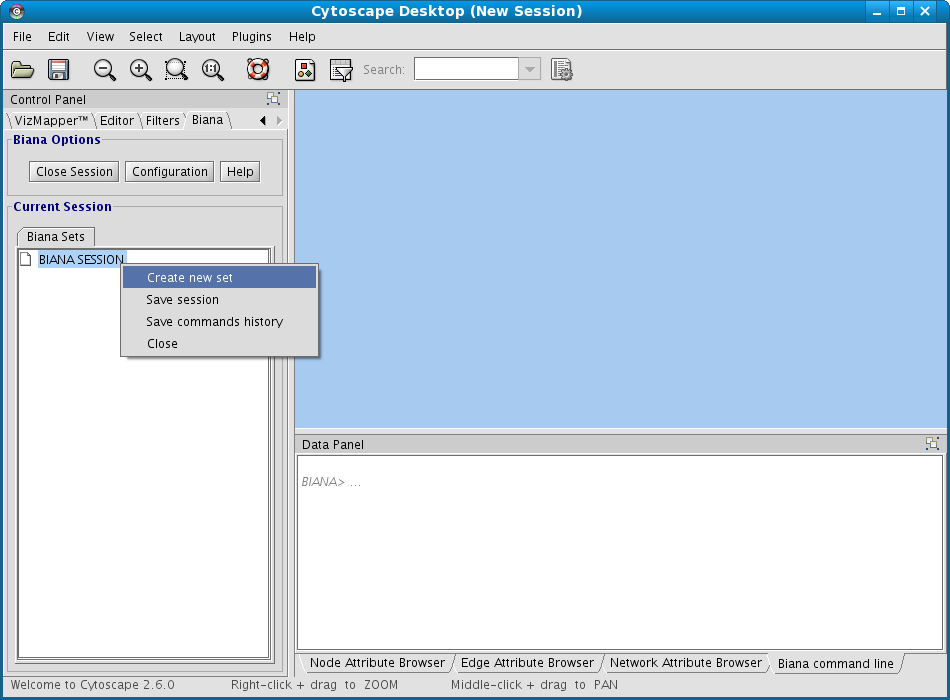
- Right-click on BIANA Session node
- Select the option Create New Set (Fig 1.6).
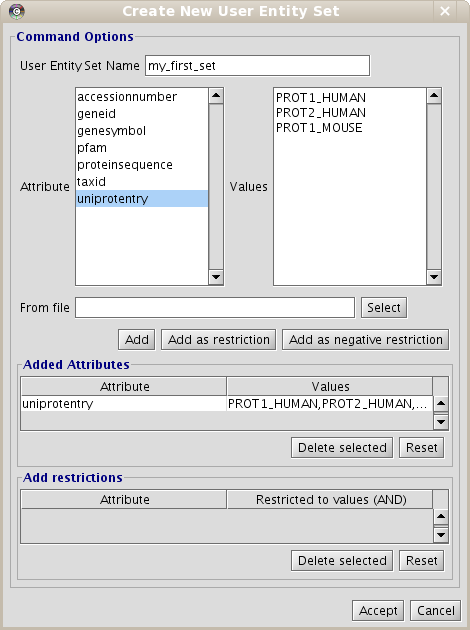
- In the appearing "Create New User Entity Set" window (Fig 1.7):
- Put the name for the new data set. Name it "my_first_set".
- Select the "uniprotentry" attribute, and add the following identifiers to the right textarea: PROT1_HUMAN, PROT2_HUMAN and PROT1_MOUSE.
- Click the Add button. A new row will appear in the Added Attributes table.
- Repeat the steps (b) and (c) for all the elements you want to be in our initial data set. In this example, it is not necessary.
| boxbackground |
When you execute the command to create a new data set, if there are no available attributes, probably you have forgotten to update databases information. Click Configuration:Update Available BIANA databases option.
- In the lateral panel, a new node has appeared in the BIANA Session tree, with the name of the new data set.
- In the BIANA terminal (Cytoscape bottom panel), the command of creating a new set has been executed.
- In the Cytoscape Desktop, a new network has been displayed (If you only observe a single node, you can change de layout by using Cytoscape Layout algorithms (Cytoscape � Layout � Cytoscape Layout. Check Cytoscape documentation to learn more about it).
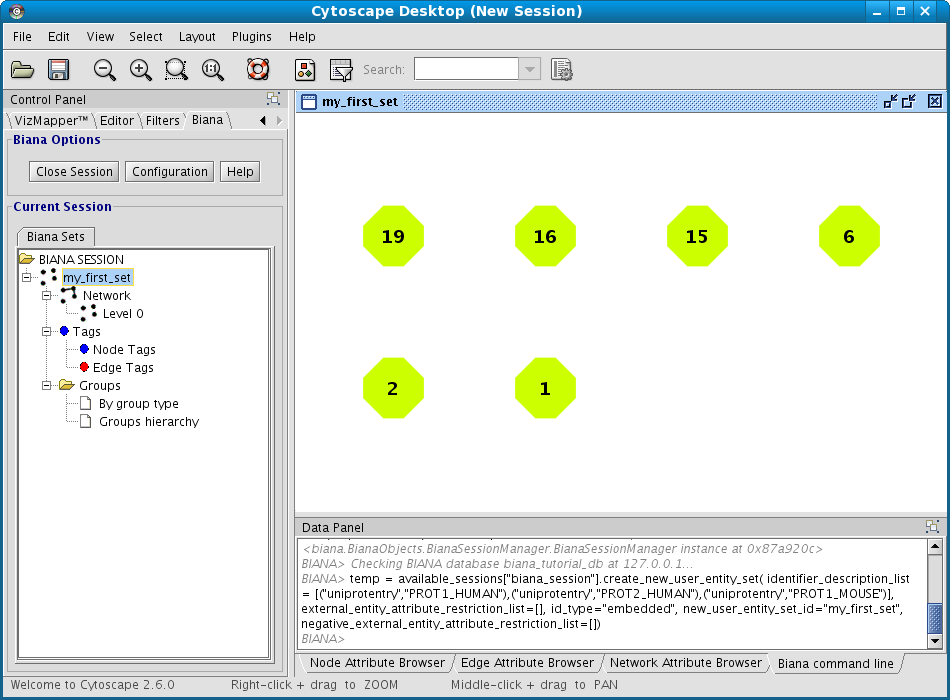
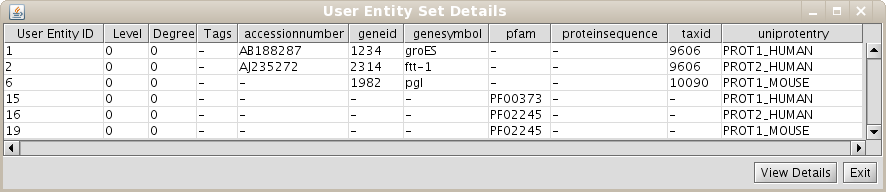
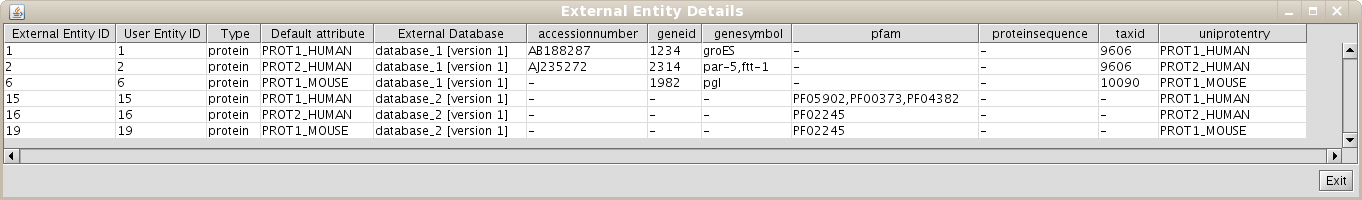
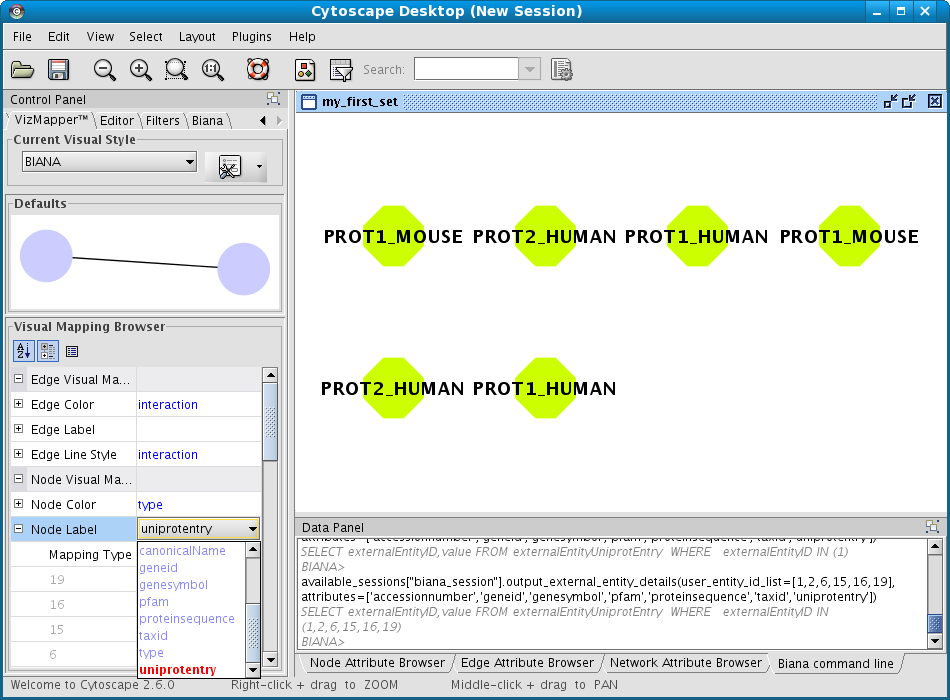
As the User Entity ID is not useful for you, once you have executed the View/Export set details, you can change the Vizmap of Cytoscape display to label the nodes in the graphical representation with the attribute you want. To do this, select the VizMapper tab in the control panel of Cytoscape (left panel), and change the Node label property by selecting the desired attribute (Fig 1.12). (see Cytoscape documentation for more details on how modifying graphical display). In this example, you can select the attribute uniprotentry to label the nodes.
1.5 Creating a Unification Protocol
We know that different External Databases reference equivalent entities, so it would be very useful to integrate them. In this example, the four External Databases have different identifiers, but they share some of them. So, you can use them to integrate the data. First, we remember which attribute or identifiers are used in each of our parsed sample databases:- input_database1.txt
- : uniprotentry, taxonomy ID, geneid, NCBI Accession Number and GeneSymbol
- input_database2.txt
- : uniprotentry and PFAM domains
- input_database3.txt
- : NCBI Accession Number, taxonomy ID and sequence.
- input_database4.txt
- : geneid
- Unify entries of databases 1 and 2 by using uniprotentry
- Unify entries of databases 1 and 4 by using geneid
- Unify entries of databases 1 and 3 by using accessionnumber
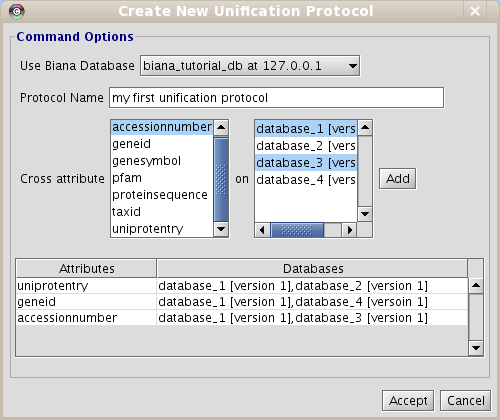
- Click on Configuration menu and then click on Create new unification Protocol.
- Enter the details of the unification protocol:
- Select the BIANA Database in which you want to create a Unification Protocol
- Put a name to the protocol (as you will be able to generate multiple unification protocols in the same BIANA Database)
- Select the attribute (or combination of attributes) and the databases you want to use to integrate data.
- Select uniprotentry attribute and databases 1 and 2
- Click the Add button.
- Select geneid and databases 1 and 4
- Click the Add button.
- Select accessionnumber and databases 1 and 3
- Click the Add button.
- Click the Accept button.
| boxbackground |
It is not mandatory to use all External Databases in the BIANA Database to create a Unification Protocol. Databases not used won't be used for the integration, and their entries won't be accessible for the sessions using this unification protocol. If you want to create a unification protocol and add an External Database without being integrated with the rest, simply add the database without specifying any attribute.
1.6 Creating a working session using a Unification Protocol
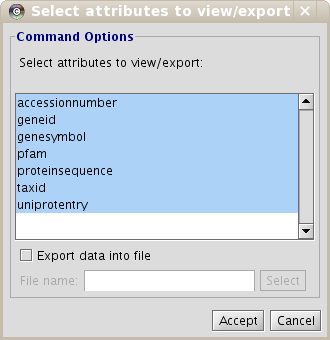
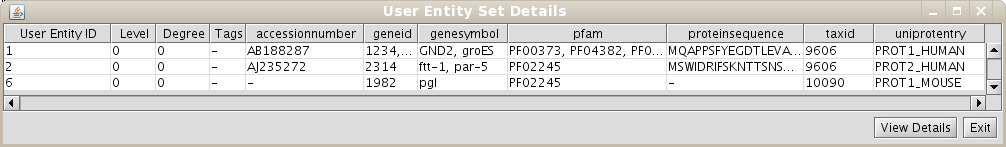
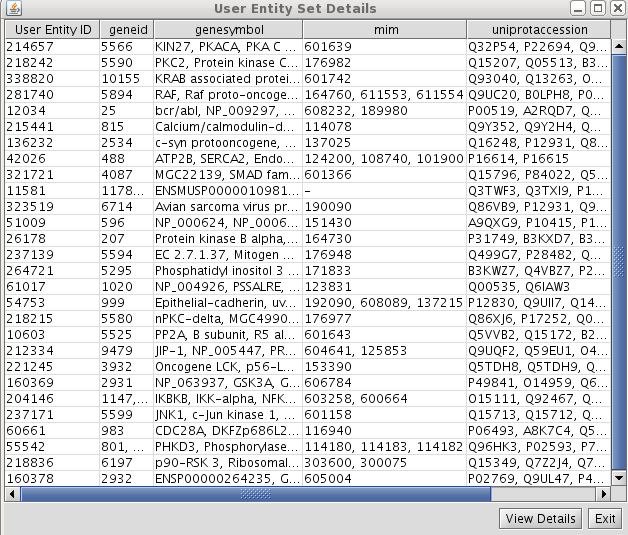
Repeat the process of starting a working session (see 1.4), but select the recently created Unification Protocol(if you are using our test BIANA Database, select the Unification Protocoltutorial_exercise1_unification1). Then, create a new User Entities, with the same uniprotEntry identifiers as used in the last example. Now, you should obtain a set with only 3 User Entities (Fig 1.14). Note: If you do not see any labels for nodes it is because you have changed VizMapper to display uniprotentry identifiers. BIANA will load information associated with entities whenever you request them explicitly from the database using View/Export set details. You will see the uniprotentry ids will appear after asking for set details.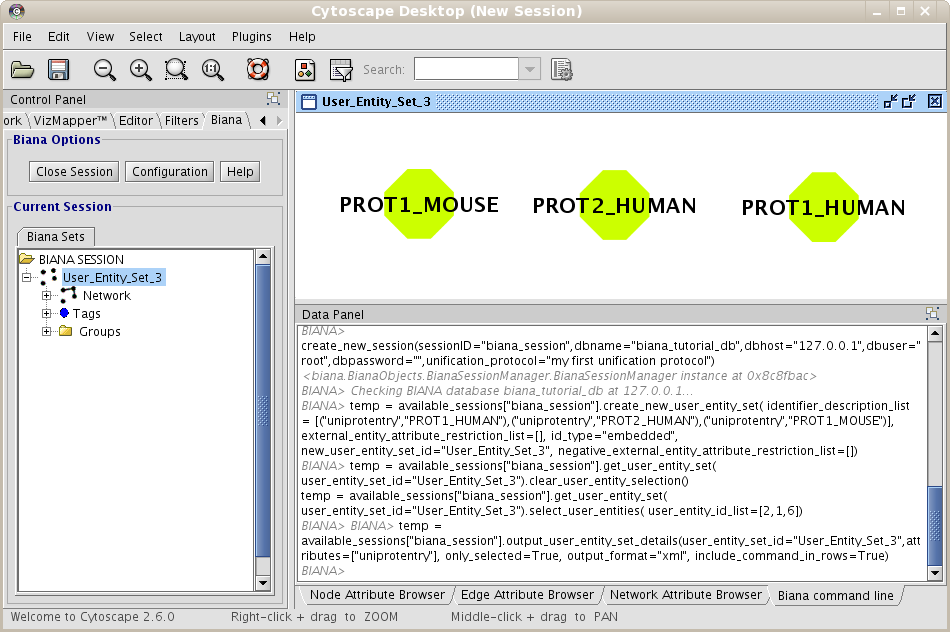
1.7 Creating unification protocols with rules having multiple attributes
In a single BIANA Database, you can create multiple Unification Protocols. Let's try other examples of Unification Protocols. In this example, you only have an External Database that tells you information about protein sequence. Let's try to create a Unification Protocol that only uses an External Database, and unifies by the attribute proteinsequence. To do it, repeat the process of creating a unification protocol adding the following parameters:- Unification Protocol name
- : protein sequence unification
- Crossed Attribute
- : proteinsequence
- External Databases
- : database_3
- Start a new BIANA Session with the tutorial database and the Unification Protocol protein sequence unification (if you are using our test BIANA Database, select the Unification Protocoltutorial_exercise1_protseq).
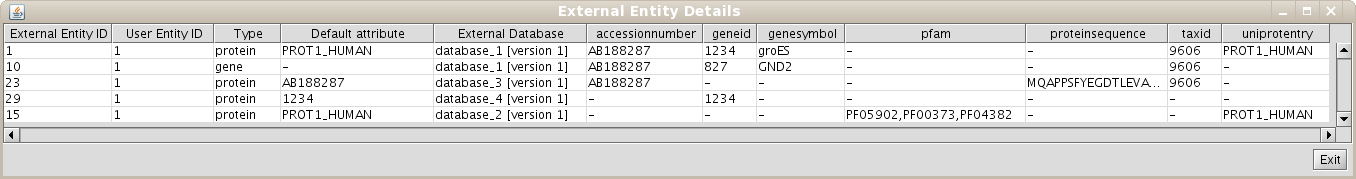
- Create a new User Entity Set, with the nodes with Accession Number AB188287 (you should obtain a single User Entity with id 1).
- View details of the set
- View the details of the node
- Create a new unification protocol as before, but select two Crossed Attributes at the same time: proteinsequence and taxid. Name it sequence and taxid unification.
- Start a new BIANA Session with the tutorial database and the sequence and taxid unification Unification Protocol(if you are using our test BIANA Database, select the Unification Protocoltutorial_exercise1_protseq_taxid).
- Create a new User Entity Set, with the nodes with Accession Number AB188287 (you should obtain a single User Entity with id 1).
- View details of the set
- View the details of the node
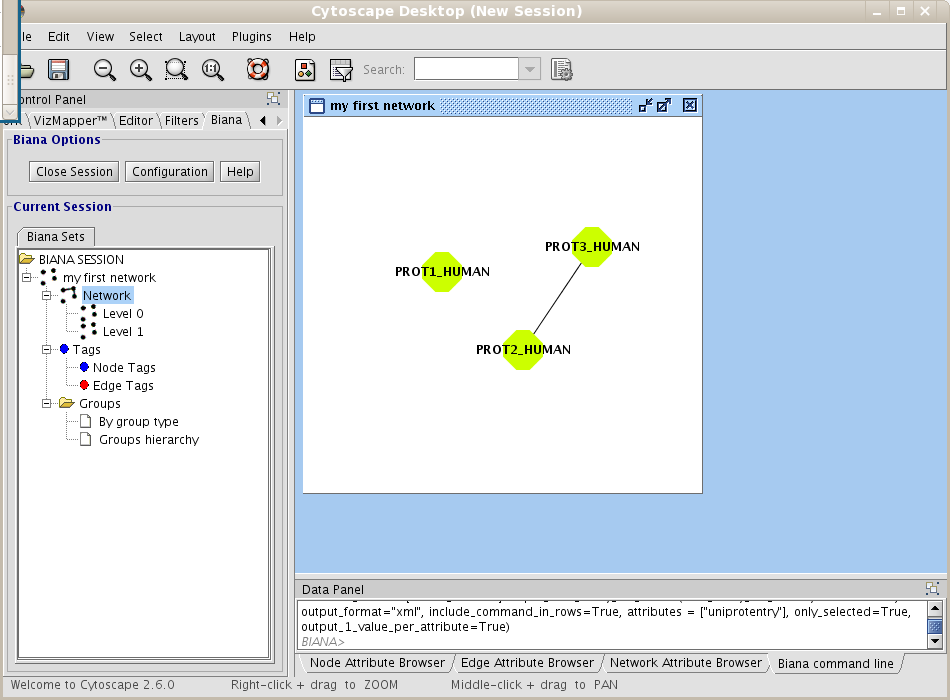
1.8 Creating my first network
If you have an opened BIANA Session, close it and start a new BIANA Session using the biana_tutorial_db and the first Unification Protocol you have created (my first unification protocol) (if you are using our online test BIANA Database, select the Unification Protocoltutorial_exercise1_protseq_taxid). First of all, you will create a network of interactions. Follow next steps:- Create a new User Entity Set, using as initial attributes the uniprotentry identifiers PROT1_HUMAN and PROT2_HUMAN. Name it my first network.
- Right-click on the set (in the BIANA Tree, in the Cytoscape left panel), and select the option Create/Expand Network (Fig 1.17).
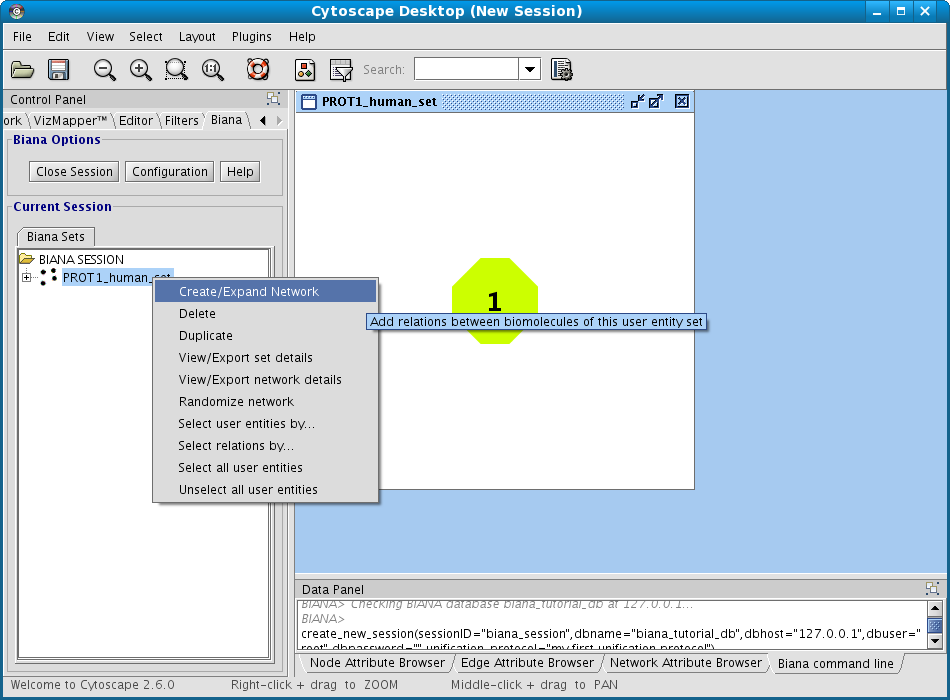
Figure 1.17: Creating a new BIANA Session. - Click on Add relations checkbox. A new pop-up window for details will appear. If it does not appear, click on Details button.
- In the relation types list, select interaction type, and then click the Accept button (Fig 1.18).

Figure 1.18: Creating a new network details. - Don't change any other parameter. Notice that the default network depth is 1, and the option of adding the relations between nodes at the last level(depth) is selected.
- Click on the Accept button.
| boxbackground |
Once you create a network, you cannot modify its parameters. If you want to create a network with different criteria, you must create a new set and then create the network or combine different sets with created networks.
1.9 Creating different kind of networks
1.9.1 Different ways of network representation
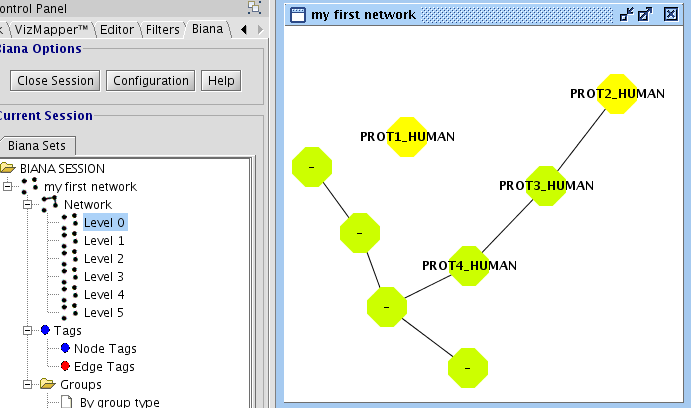
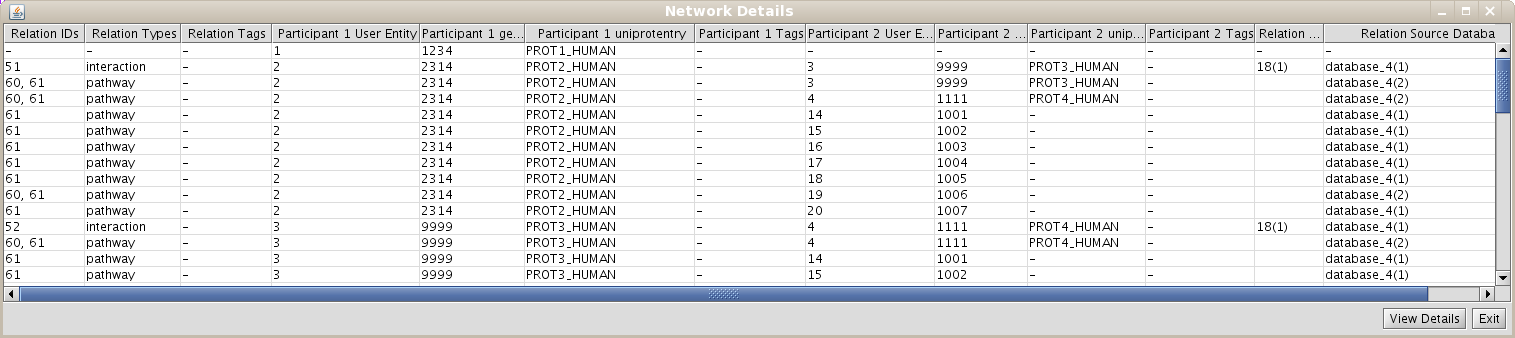
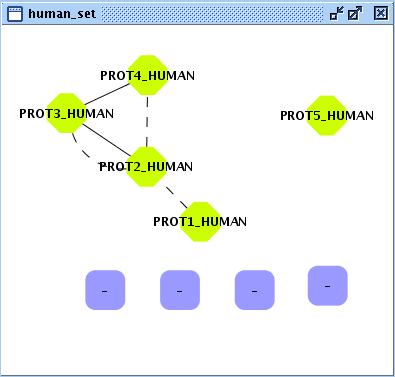
In the last example, you have seen how to create a network of relationships of the type "interaction" between User Entities. However, it would be interesting to create networks that contain different kind of relations. In our example database (see details on file input_database4.txt), you have inserted the following relation types: "interaction","complex","reaction", and pathways". If you repeat all the last steps of the previous example, and select all this type of relations, you should observe a network with 11 nodes an 57 edges (see Fig 1.22).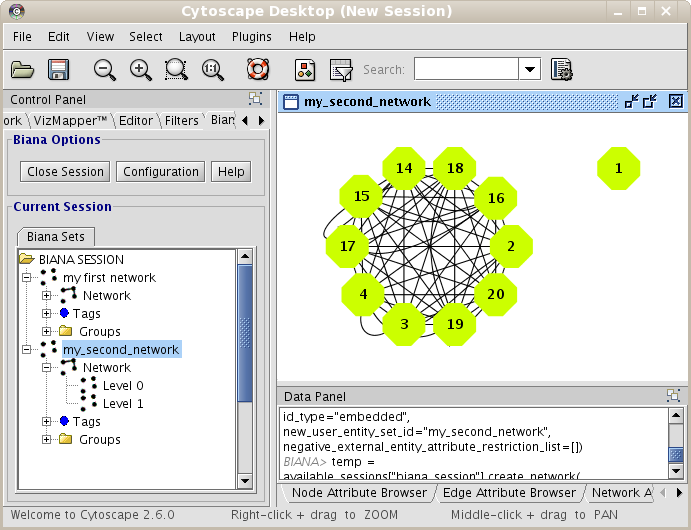
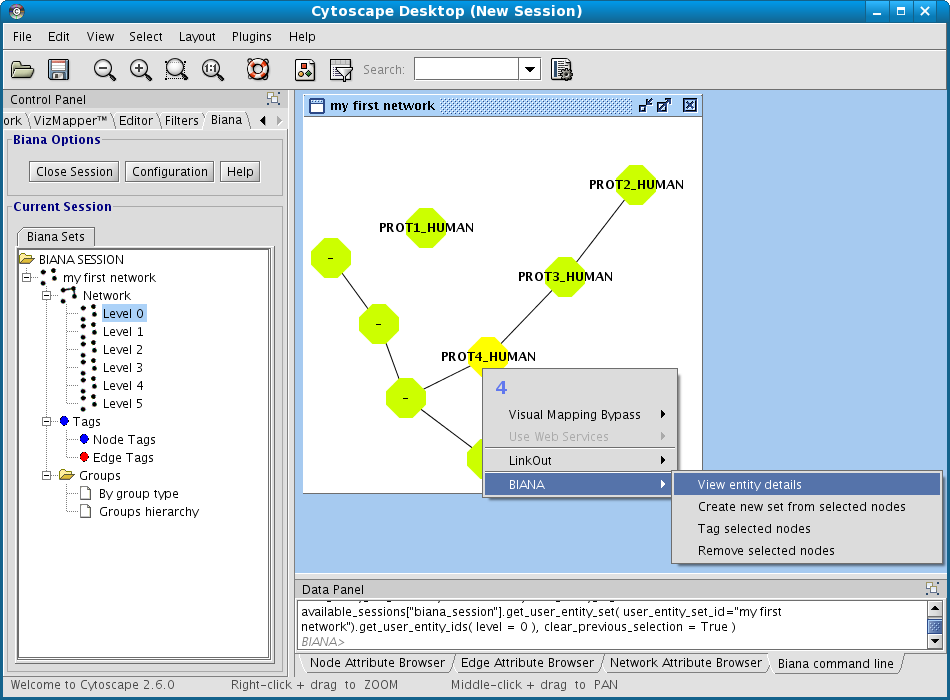
- Right-click on your set you want to see network details in the BIANA Tree.
- Select the View/export Network Details in the pop-up menu.
- Select the participant and relation attributes to be printed and click Accept.
- A new window will appear displaying the detailed info about the relations (Fig 1.23)
- Change the way Cytoscape shows a relation. For example, a relation of the type complex can be interesting to be represented as a node in the graph, and all participants linked to this node. To change the way a type of relationship is represented:
- Click on Configuration button in BIANA menu, and select Preferences.
- Select the relation types you want to represent as nodes.
- Add relationships as groups instead of as edges. In this case, new nodes are added to the network, but no new edges are added. A new group is created for each relationship belonging to these relationship types, and all User Entities participating in these relationships will be added to the groups respectively. To do this, add the relation types in the category Add relations as GROUPS instead of Add Relations, in the Create/Expand Network window.
- Create a new data set with the same root proteins (PROT1_HUMAN and PROT2_HUMAN).
- Change the Complex relation type to be represented as a node.
- Create the network. In the network dialog window, select interaction, complex and reaction in relation types in the Add Relations category, and pathway in the Add relations as GROUPS category.
| boxbackground |
Relationships added as groups are not added as edges in the network. Consequently, they won't affect node degree, network topology, etc.
1.9.2 Creating a network of attributes
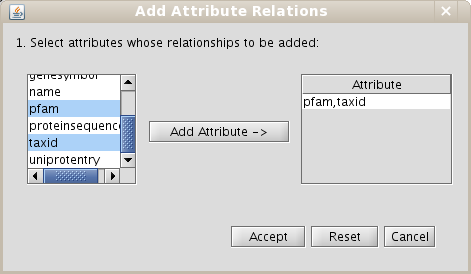
BIANA offers the possibility to create a network by defining an edge between two entities that share one or more attributes. To illustrate this, you will create a set with all entities that have a uniprotentry identifier, and a network of relationships by sharing the same specie (Fig 1.25).- Create a new set of data with all entities that have a uniprotentry identifier. To do this, select the uniprotentry attribute and add the character * as value.
- Go to the Create/Expand Network menu, select the option Add attribute relations and add the attribute taxid.
- Select the option to create a network at level 0. This will create the network of relationships using only the nodes from the initial set.
- Click the Accept button.
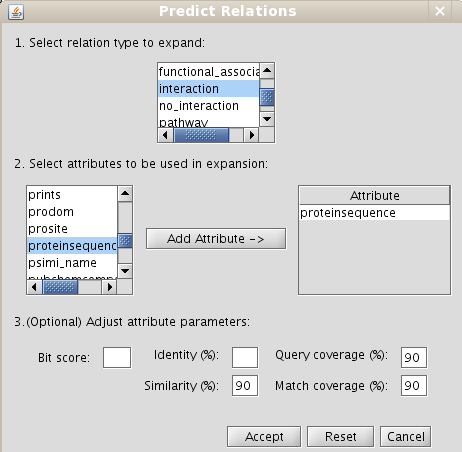
1.9.3 Making predictions: Expanding relationships between nodes sharing one or more attributes
In some cases, it may be interesting to extrapolate edges between two entities to other two entities because they share some attributes (for example, an interaction has been reported between two proteins in a specie, and you want to extrapolate this interaction to their homologous proteins in other specie (interologs). BIANA allows to extrapolate any type of relationships between nodes if they share one or more attributes at the same time (attributes can be: sequence homology, PFAM domains, structural domains, etc... In Chapter 5, we show a practical example on how expand by sequence homology. In the current example, you will expand edges between nodes sharing PFAM domains. Follow next steps:- Create a new set for all human proteins (adding the taxid 9606). Add also taxid 9606 as a restriction (this restriction means all nodes in this set must have this attribute. Initial restrictions are applied in all operations in the data set).
- Select the command Create/Expand network. In the network creation dialog:
- Select the interaction relation type in the section Add relations
- Select the interaction relation type in the section Make predictions by sharing attributes and add the PFAM attribute to do expansions (Fig 1.29)
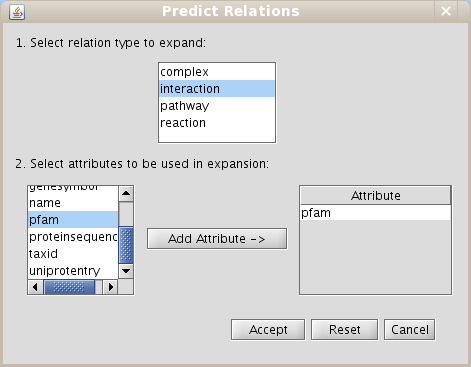
Figure 1.29: Predict relations by expansions dialog - Select Level 0
- Click Accept
1.10 Removing Unification Protocols
Before continuing, you are going to delete last Unification Protocols you have created. If you are using our test BIANA Database, skip this section, as you don't have permissions to delete a Unification Protocol. Follow the following steps to delete one or more unification protocols:- Click on Configuration menu and then click on Delete Unification Protocol.
- Select the BIANA Database in which you want to delete one or more Unification Protocol.
- Click the Accept button.
| boxbackground |
This action is not reversible. Once you delete a Unification Protocol, you can not revert the changes. If you want a backup, see the example on the tutorial.
1.11 Removing BIANA Databases
Finally, to finish this exercise, you are going to delete BIANA Database you have created for this exercise. If you are using our test BIANA Database, skip this section, as you don't have permissions to delete a BIANA Database. Follow the following steps:- Click on Configuration menu and then click on Delete BIANA Database.
- Select one or multiple BIANA Databases you want to delete.
- Click the Accept button.
| boxbackground |
This action is not reversible! Once you delete a Unification Protocol or BIANA Database, you can not revert the changes! If you want a backup, see the example on the tutorial.
Chapter 2
Working with Multiple Data Sets
In this chapter, you will go over most of the operations that can be done with one or multiple data sets, such as union, intersection, selection, tagging, etc.
Before you start, you will create a new BIANA database with real biological data (skip this section if you are using the online test BIANA Database):
- Create a new BIANA database: Name it biana_tutorial2.
- Parse external databases: Parse the following databases.
- Uniprot SwissProt
- Reactome
- Taxonomy
- PSI-MI OBO
- IntAct
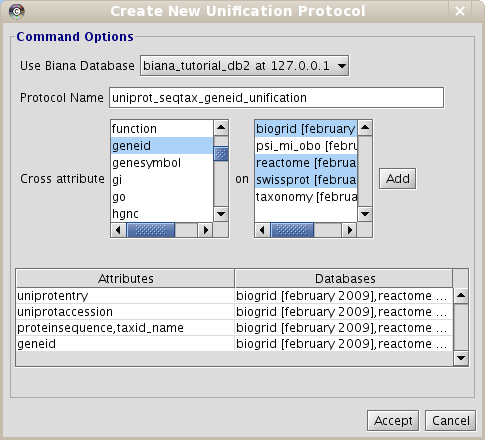
- Create the Unification Protocol: Use the following unification protocol and name it uniprot_seqtax_geneid_unification (Fig 2.1):
- Attribute uniprotentry between SwissProt,Reactome and IntAct.
- Attribute uniprotaccession between SwissProt,Reactome and IntAct.
- Attributes proteinsequence and taxid between SwissProt,Reactome and IntAct.
- Attribute geneid between all databases.
2.1 Generate different datasets with initial sets of biomolecules of interest
Once you have unified, start a BIANA working session with the Unification Protocol you have created (if you are using our online test BIANA Database, use the Unification Protocoltutorial_exercise2_uniprot_seqtax_geneid_unification). Then, create the following User Entity sets using the following data:- Alzheimer set: keyword Alzheimer in their Description, Name and Disease attributes.
- Diabetes set: keyword Diabetes in their Description, Name, Function and Disease attributes.
- Human Diabetes set.
- keyword Diabetes in their Description, Name, Function and Disease attributes.
- Only human (by adding attribute taxid 9606 as restriction OR taxid_name human) Notice that here you can use the attribute taxid_name because you have inserted Taxonomy database into BIANA. Otherwise, you would not be able to use this attribute. (See "special" attributes section in the BIANA manual).
2.2 Union and intersection of different data sets
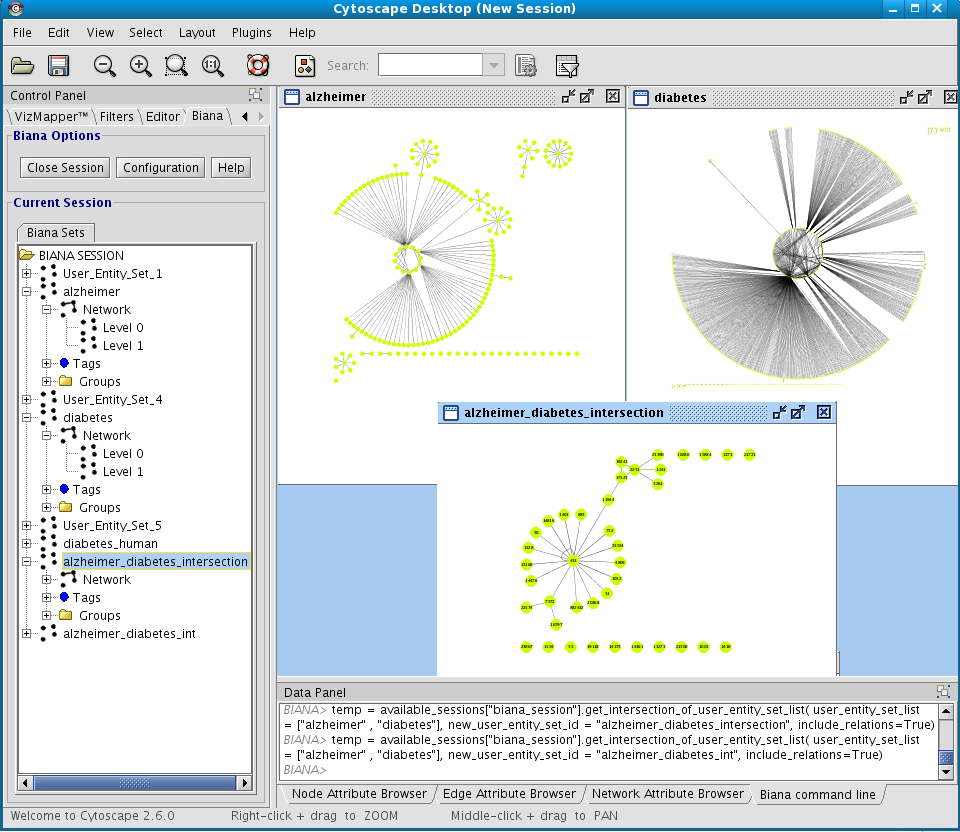
You can obtain a new User Entities by the combination of others. For this, you can select multiple User Entity Set in the BIANA tree. Then, right-click and select the operation you want to perform. For example, you can do:- Intersection between Alzheimer Set and Diabetes Set.
- Create a network of interactions at level 1 for Alzheimer Set and Diabetes Set and the obtain again a new User Entities with the intersection between them.
2.3 Selecting a subset of entities by having some attributes or tags
You can select User Entities in a User Entity Set using different criteria. For this:- Right-click on the User Entity Set whose User Entities you want to select.
- Select the option Select user entities by attribute/tag.
- Specify the attributes
2.4 Selecting a subset of entities from an existing set
You can select User Entities in a User Entity Set that also belong to another User Entity Set. This can be thought as intersection of the User Entities (nodes) of two User Entity Set without the need of creating a new set (usually used in combination with tagging). For this:- Right-click on the User Entity Set whose User Entities you want to select.
- Select the option Select user entities from existing set.
- In the pop-up window, select User Entity Set whose User Entities will be checked for existence in the current User Entity Set.
2.5 Tagging biomolecules using different criteria
You can tag selected nodes and edges to get them again later without having to select them again. To tag nodes or edges, you must Right-click on one selected element in the Cytoscape plugin, and select the option BIANA � Tag selected nodes. For example, tag the last selection you have done with the tag Intersection.
Chapter 3
Handling Indirect Biological Relations: Pathways as Groups of Biomolecules
In this chapter, you will exploit capabilities of BIANA to gather and analyze interaction information of a molecule of interest when the interaction information is in the form of indirect relation such as belonging to a particular pathway. In this example you will work with an inducible isozyme of Prostaglandin-endoperoxide synthase, PTGS2 that plays a key role in biosynthesis of the prostanoids. Use the BIANA Database you have created in Chapter 2.
You will first create the set of biomolecules associated with PTGS2 and then create its network.
- Create a BIANA working session with the Unification Protocol that has been created in the second chapter.
- Create a new User Entity Set with entries associated with "PTGS2" in their name attribute and call it as "ptgs2".
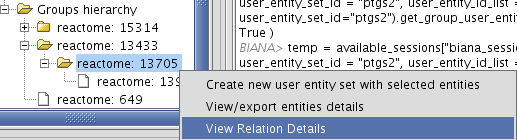
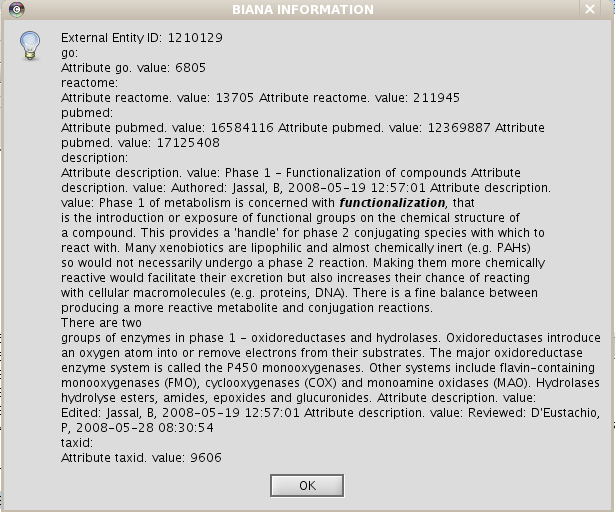
- Create/Expand Network for the User Entity Set
- Add all relation types but "pathway"s excluding last level relations in Add relations.
- Add "pathway" relations as groups in Add relations as groups.
- View/Export set details selecting uniprotentry and change the Cytoscape VIZMAP to label the nodes according to uniprotentry codes.
Chapter 4
Introducing User Defined Data
BIANA provides some default database parsers for most common databases and formats. BIANA has been designed to be able to store any kind of biologic database, relying on the needs of the user to integrate data between databases by choosing which combinations of attributes must be shared. However, due to the large number of different databases, formats and versions, not all databases with biologic data have a current BIANA Parser. Despite existing interchange standard formats, databases often change their formats, so parsers are not guaranteed to work in all database versions. In order to solve this problem, we provide a set of default parsers, that will be updated in the BIANA web page (http://sbi.imim.es/web/BIANA.php).
However, probably you are interested in having a parser for another External Database, or inserting your own data into BIANA to integrate it with other External Database.
There exist two ways to insert your own data into BIANA:
- Convert your data to a specific format. BIANA proposes a tabulated format (see example files of the theoretical example you have seen in the first tutorial exercise). For more details on how is it the format, check the BIANA reference manual.
- Create your own parser and add it to BIANA.
4.1 Introducing a user specific database
If you are using our test BIANA Database, skip BIANA Databasecreation and unification steps. You must use the test BIANA Database Unification Protocolinferred_metabolic_network. In this example, insert a specific External Databaseby using a specific parser created specifically for it:- Download raw data from a database build in our lab (Dataset called Metabolic Network at http://sbi.imim.es/web/BIANA.php?page=biana.datasets.
- Download specific parser for this dataset in the same webpage, and copy it under the biana/BianaParser directory (the location of this directory will depend on your installation procedure!).
- Restart the Graphical Interface to make the new parser available.
- Create a new Biana Database (see tutorial example 1) and populate it with:
- Our specific Metabolic Network database using the downloaded parser (called inferred_metabolic_network).
- Uniprot Swissprot
- Unify using the following Unification Protocol atoms:
- EC code
| boxbackground |
If you are interested in learning how to create a parser, check at http://sbi.imim.es/web/BIANA.php?page=biana.parsers. You can use this parser as an example on how to create a BIANAParser. It is advisable to check your new parsers in empty BIANA Databases to avoid inserting errors in existing BIANA Databases.
Introduction to our metabolic network database
This dataset corresponds to a metabolic network reconstruction that gives an score to each pair of possible chained enzymatic reactions. These chained reactions are possible when there is at least one chemical compound acting at the same time as product of enzyme A and substrate of enzyme B, a shared compound. The score is based in the plausibility of observing such chemical compounds, according to their own frequency and the frequency of other products of enzyme A and other substrates of enzyme B which do not take part in chaining reactions. Most of existing methods for reconstructing metabolic networks disregard relationships in which enzymes only share very frequent compounds. The method from which this dataset is derived tries to discern whether these relationships can be taken into consideration or not. Hence, cases in which a relationship between two enzymes can only be established due to the presence of shared common compounds are tagged as "special". Often, a given enzyme, described by an EC code, can perform a given reaction bidirectionally (from substrates to products and vice versa) and/or can perform more than a single reaction. The provided score is specific for the reaction each enzyme is performing in the relationship and their directions. It is recommended to use high reliability scores (pValue <= 0.05).Database information description
In this External Database, we have the following information we want to insert into BIANA:- ENZYME A: EC code of enzyme A
- ENZYME B: EC code of enzyme B
- Score: score for the relationship enzyme A – enzyme B
- pValue: p-value associated to the score
- KEGG RA: KEGG reaction code for enzyme A
- KEGG RB: KEGG reaction code for enzyme B
- Dir A: direction of reaction of enzyme A (d: direct, from substrates to products; r: reverse, from products to substrates)
- Dir B: direction of reaction of enzyme B (d: direct, from substrates to products; r: reverse, from products to substrates)
- SPECIAL: True if the relationship corresponds to a special case; false if not.
- Common metabolites: number of metabolites allowing the relationship between the two reactions
- External Entity Types: protein for External Entity and reaction for External Entity Relation . They already exist in default BIANA External Entity types, it is not necessary to add them.
- External Entity Attributes and External Entity Relation Attributes:
- EC. It already exists in default BIANA External Entity attributes, it is not necessary to add it.
- External Entity Relation Attributes:
- Score. It already exists in default BIANA External Entity attributes, it is not necessary to add it.
- Pvalue. It already exists in default BIANA External Entity attributes, it is not necessary to add it.
- Difficulty. This is very specific for this database, and it does not exist in BIANA default External Entity attributes. To add it, add the value ("Difficulty","enum(\"Special\",\Ëasy\")") in the EXTERNAL_ENTITY_IDENTIFIER_ATTRIBUTES list in BIANA_GLOBALS file.
- CommonMetabolitesNumber. This is very specific for this database, and it does not exist in BIANA default External Entity attributes. To add it, add the value ("CommonMetabolitesNumber","integer(2)") in the EXTERNAL_ENTITY_IDENTIFIER_ATTRIBUTES list in BIANA_GLOBALS file.
- External Entity Relation Participant Attributes:
- Direction. This is very specific for this database, and it does not exist in BIANA default External Entity relation participant attributes. To add it, add the value ("Direction","enum(\"direct\",\"reverse\''') in the EXTERNAL_ENTITY_RELATION_PARTICIPANT_ATTRIBUTE_TYPES list in BIANA_GLOBALS file.
- KEGG. It already exists in default BIANA External Entity attributes, it is not necessary to add it.
4.2 Create a network using your own data
Finally, you will create a network with your data. Create an initial data set:- All entities having an EC code
- All entities belonging to human (taxid 9606). Note that you cannot use the taxid_name as you have not inserted Taxonomy External Database.
- Reactions having an score greater or equal to 1.5 (In Add Relations dialog add score as a relation restriction attribute with the value of " > =1.5")
- Reactions having an score greater to 1.5 and having the difficulty attribute ßpecial"
Chapter 5
Generating and Using Sequence Similarity Information for Predictions Based on Interologs
More often than not, we are interested in inferring relations through similarity between molecules. For this purpose it is necessary to know all vs all sequence similarity of biomolecules stored in BIANA. However, BIANA contains redundant sequence information coming from biological data sources in its data repository. To be able to make accurate predictions based on sequence similarity, first we need to eliminate duplicate sequences and then calculate sequence similarities. In this chapter, you will discover how to remove repeated sequences in a BIANA database and how to do sequence-based interaction predictions.
You will use the BIANA Database created in Chapter 2.
In order to execute this example, you must have installed in your computer the following software:
- blastpgp and bl2seq (http://www.ncbi.nlm.nih.gov/BLAST/download.shtml)
- CD-HIT (http://bioinformatics.ljcrf.edu/cd-hi/)
- FORMATDB_EXEC = 'YOUR_ABSOLUTE_BLAST_PATH/bin/formatdb'
- BLASTALL_EXEC = 'YOUR_ABSOLUTE_BLAST_PATH/bin/blastall'
- BL2SEQ_EXEC = 'YOUR_ABSOLUTE_BLAST_PATH/bin/bl2seq'
- CD_HIT_PATH = 'YOUR_ABSOLUTE_CD_HIT_PATH'
5.1 Calculating similarity of non redundant sequences in the BIANA Database
As mentioned above, similarity of sequences in the database is of utmost interest while discovering inferred relationships between sequences. BIANA provides a shell script (for POSIX based OSs) to remove duplicated sequences and to calculate sequence similarity between all sequences in the database. This script, called process_sequences.sh can be found under{scripts/administration/} directory. The parameters of this script describing the database to use and the "identity-threshold" of CD-HIT clusters, are hard coded in the beginning of the file. Identity threshold of CD-HIT clusters (variable named "identity") can have values in-between 0 and 1 denoting the percentage of identity among members of the same cluster. All pairwise sequence alignment will be conducted between those elements in the same cluster afterwards. Once you set database-specific parameters and CD-HIT cluster identity parameter at the top of the file, make sure that program paths for BLAST and CD-HIT are properly set in BIANA_GLOBALS file. Then, execute the command line:
./process_sequences.sh
This script works in two steps as explained in the next sections (Approximate running time for the example database with the specified configuration is less than one quarter of an hour).
5.1.1 Removing sequence redundancy in the BIANA Database
First all the sequences in the BIANA Database are taken from database and duplicates are found using "shell" utilities like sort and unique. Then, non-redundant sequences are inserted back into the BIANA Database. At this step eliminate_duplicate_sequences.py python script is used to handle this task.5.1.2 Calculating sequence similarities in BIANA Database
In the second step, calculate_sequence_similarities.py python script is used to get sequences from database, finding CD-HIT clusters, running BLAST and inserting the sequence similarity information to the database.5.2 Making predictions using sequence similarity: Sequence interologs
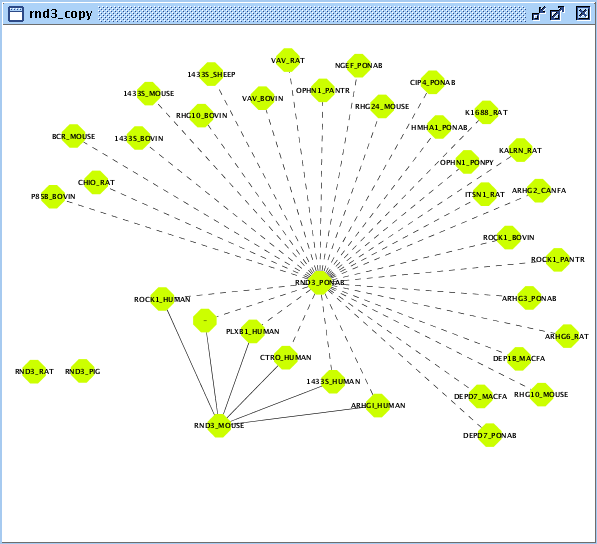
In this example, you will exploit sequence interologs of a small signaling G protein (GTPase): RND3. Let's start with creating the set of user entities associated with this biomolecule.- Create a BIANA working session with the Unification Protocol that has been created in the second chapter.
- Create a new User Entity Set with entries associated with "RND3" as geneSymbol and name it as "rnd3".
- Duplicate created User Entity Set by right clicking on the newly created set on BIANA Tree and name it as "rnd3_copy".
- Create/Expand Network for the User Entity Set named "rnd3" adding relation type "interaction" excluding last level relations in Add relations.
- View/Export set details selecting uniprotentry and change the Cytoscape VIZMAP to label the nodes according to uniprotentry codes.
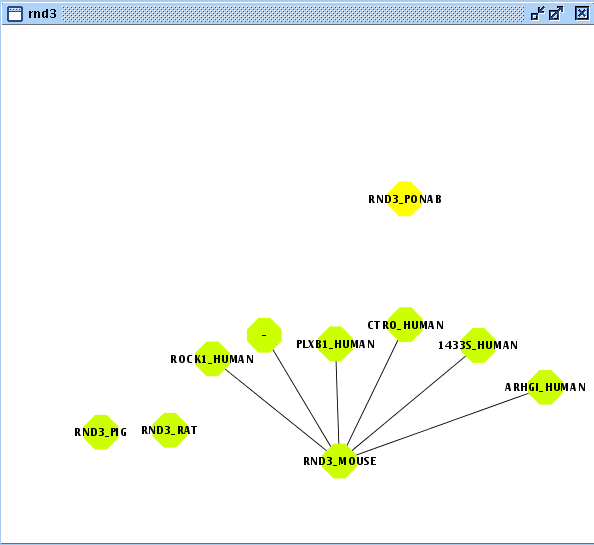
- Create/Expand Network for the User Entity Set named "rnd3_copy"
- Add relation type "interaction" excluding last level relations in Add relations.
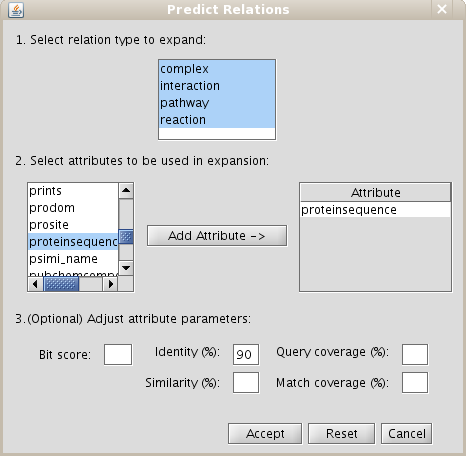
- Add relation type "interaction" types excluding last level relations in Make predictions by sharing attributes also add proteinsequence attribute with identity parameter set at 90 as demonstrated in Fig 5.2.
- View/Export set details selecting uniprotentry.
Chapter 6
Putting It All Together: A case study of investigating common mediators in Alzheimer and Diabetes using network biology approach
This final chapter focuses on how BIANA can assist to investigate real life problems based on a case study. Please refer to the relevant section of the previous chapters if you can not figure out how to achieve explained behaviour.
In case you are interested in executing this example from command line or checking step-by-step all the executed BIANA commands, you can find the script at http://sbi.imim.es/data/biana/scripts/exercise6_script.py. You can also find a video of some parts of this example at http://www.youtube.com/user/bianatutorial
6.1 Creating a comprehensive BIANA database and an extensive unification protocol
Considering that Alzheimer's disease (AD) and diabetes are known to be coupled where having diabetes bears an increased risk for AD. Let's say, for instance, you are interested in proteins that may possibly play an important role both in Alzheimer's disease and diabetes. BIANA is perfectly suited for pursuing such kind of tasks where one needs to fetch specie-wide sequence annotation and interaction information spread across various data resources in a user-friendly and time inexpensive manner. First, you need to create a more comprehensive database for this task. The new BIANA database contains the following databases (see Sections 1.2 and 1.3, the databases inserted as promiscuous are marked with a star[*]): 3- SwissProt
- Uniprot Trembl
- NCBI Taxonomy
- PSI-MI OBO
- GO
- SCOP*
- HGNC
- IPI
- IntAct*
- DIP*
- MPACT*
- HPRD*
- MINT*
- BioGrid*
- Reactome*
- KEGG Gene
- KEGG KO
- KEGG Ligand
- Attribute uniprotaccession between all databases but Taxonomy, PSI-MI OBO and GO
- Attributes proteinsequence and taxid between all databases but Taxonomy, PSI-MI OBO and GO
- Attribute geneid between all databases but Taxonomy, PSI-MI OBO and GO
- Attribute scop between SwissProt, Trembl and SCOP
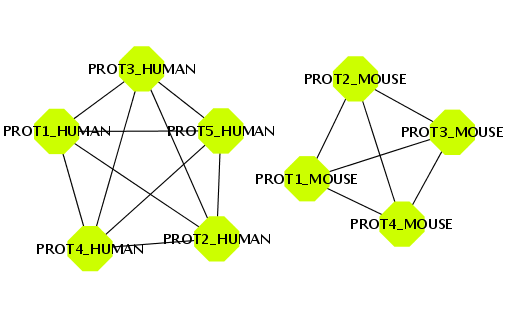
6.2 Analysis on the mouse interactome
Once the database and the unification protocol is created, start a new BIANA working session (see Section 1.6) and create the following user entity sets (see Section 1.4):- "alzheimer_mouse_0": set of proteins associated with Alzheimer's disease in mouse proteome (adding "alzheimer" as name, keyword, description, disease and function attributes and adding the restriction of "10090" as taxid attribute in Create a new set window)
- "diabetes_mouse_0": set of proteins associated with diabetes (adding "alzheimer" as name, keyword, description, disease and function attributes and adding the restriction of "10090" as taxid attribute in Create a new set window)
- "alzheimer_mouse_1": relations of proteins including "interaction", "complex" and (biochemical)"reactions" as relation types at level 1, without last level relations in Create relation network window
- "diabetes_mouse_1": relations of proteins including "interaction", "complex" and (biochemical)"reactions" as relation types at level 1, without last level relations in Create relation network window
| User Entity Set Name | Number of User Entities | Number of interactions |
| alzheimer_mouse_0 | 9 | 0 |
| diabetes_mouse_0 | 23 | 0 |
| alzheimer_mouse_1 | 760 | 784 |
| diabetes_mouse_1 | 162 | 208 |
| intersection_mouse_1 | 28 | 4 |
6.3 Analysis on the specie-wide interactome
Turning our attention to the interaction network of specie independent proteome (not restricting to mouse) to be able to increase number of possible candidates we create interaction networks for all proteins available in BIANA associated with AD and diabetes using the same keywords as above (except that we do not add restriction based on taxid attribute). Adopting the same naming convention as before, We name these User Entity Sets as "alzheimer_0" and "diabetes_0" to describe initial sets of AD and diabetes associated proteins and "alzheimer_1" and "diabetes_1" to describe their interaction networks. This time, intersection network itself does not give much information on the possible relevance of the pathologies of the included nodes with its considerable size (see Table 6.2) due to including specie-wide information. Next, you can filter the proteins contained in these two networks, so that only proteins linked at least to two Alzheimer-associated proteins or to two diabetes-associated proteins ar taken into accound. This is done by following these steps:- Select User Entities initially associated with Alzheimer in "alzheimer_1"
- Go to Network, click Level 0 to select User Entities at level 0
- Alternatively you can use User Entity Set "alzheimer_0" and select User Entities from existing set (see Section 2.4
- Tag these selected User Entities with the keyword "alzheimer" (see Section 2.5)
- Select User Entities that are linking at least 2 of the tagged User Entities
- Right-click on User Entity Set "alzheimer_1" and click Select user entities by attribute/tag (see Section 2.3)
- In the pop-up window select by tag linkage: "alzheimer" (nodes connecting at least 2 tagged nodes)
- Create a new set from the selected User Entities with the name "alzheimer_1_linking"
- Right-click a selected User Entity and follow BIANA � Create new set from selected nodes
- Alternatively, select User Entity Set on the session tree and follow Tags rightarrow Node Tags rightarrow "alzheimer". Then right-click and select Create new set from selected nodes
- Select User Entities initially associated with Diabetes in "diabetes_1"
- Go to Network, click Level 0 to select User Entities at level 0
- Alternatively you can use User Entity Set "diabetes_0" and select User Entities from existing set (see Section 2.4
- Tag these selected User Entities with the keyword "diabetes" (see Section 2.5)
- Select User Entities that are linking at least 2 of the tagged User Entities
- Right-click on User Entity Set "diabetes_1" and click Select user entities by attribute/tag (see Section 2.3)
- In the pop-up window select by tag linkage: "diabetes" (nodes connecting at least 2 tagged nodes)
- Create a new set from the selected User Entities with the name "diabetes_1_linking"
- Right-click a selected User Entity and follow BIANA � Create new set from selected nodes
- Alternatively, select User Entity Set on the session tree and follow Tags rightarrow Node Tags rightarrow "diabetes". Then right-click and select Create new set from selected nodes
| User Entity Set Name | Number of User Entities | Number of interactions |
| alzheimer_0 | 74 | 0 |
| diabetes_0 | 169 | 0 |
| alzheimer_1 | 1616 | 1922 |
| diabetes_1 | 2565 | 3667 |
| intersection_1 | 457 | 805 |
| intersection_1_linking | 51 | 0 |
| GO Term | Description | P-value | Enrichment (N, B, n, b) |
| GO:0019900 | kinase binding | 4.26E-5 | 3.83 (370,21,46,10) |
| GO:0019899 | enzyme binding | 2.68E-4 | 2.41 (370,50,46,15) |
| GO:0019901 | protein kinase binding | 3.24E-4 | 3.79 (370,17,46,8) |
| GO:0016773 | phosphotransferase activity, alcohol group as acceptor | 8.88E-4 | 2.19 (370,55,46,15) |
| GO:0045309 | protein phosphorylated amino acid binding | 9.64E-4 | 6.43(370,5,46,4) |
6.4 Analysis on the homology extended interactome
In order to increase the list of potential candidates, you can repeat the analysis including predictions obtained using the interology concept (i.e. transferring interactions from proteins to their homologous pairs). Before starting this step, it is necessary to obtain sequence similarity data (see Chapter 5). Once homology data is calculated, we repeat the same steps as for specie-wide interactome, but adding transferred interactions by means of protein sequence similarity:- Create initial "alzheimer" and "diabetes" as in the previous example (without restricting specie).
- Create network for both "alzheimer" and "diabetes" sets:
- Add relations: Relations of proteins including "interaction", "complex" and (biochemical)"reactions" as relation types at level 1, without last level relations in Create relation network window.
- Make predictions by sharing attributes: Predictions of interactions (select "interaction" in the relation type to expand), and add the attribute "proteinSequence". Set the percentage similarity value to 90, and query and match coverage to 90 (it means at least both similar proteins must match in its 90% sequence length) (Fig 6.2).
| User Entity Set Name | Number of User Entities | Number of interactions |
| alzheimer_0 | 74 | 0 |
| diabetes_0 | 169 | 0 |
| alzheimer_1 | 3466 | 3866 |
| diabetes_1 | 6987 | 16447 |
| intersection_1 | 2894 | 6846 |
| intersection_1_linking | 221 | 81 |