Comparative modelling and analyse of Virulence related
protein Nf314 of Naegleria fowleri
Cristina Gamell, Ariadna Laguna & Bàrbara Laviña
Index ![]()
METHODS & RESULTS
SUMMARY 
Naegleria
fowlreri could be a pathogen causing primary amoebic
meningoencephalitis (PAM). The study of this protein will improve strategies
for prevention and treatment of the illness. A model from the Virulence related
protein Nf314 from Naegleria fowleri (P42661), has been
done by Comparative Modelling using serine carboxypeptidases as templates. P42661 is a member
of serine carboxypeptidases family; it has the characteristics Catalytic triad
(Ser, His and Asp) and oxyanion hole conserved.
The
findings of this work permit to settle the hypothesis that possible substrates
from Nf314 could be human proteins of the extracelular matrix. The Nf314
protein could cleavage these proteins allowing Naegleria fowleri to
penetrate the human body trough the nasal cavities, reaching the central nervous
system and causing the primary meningoencephalities.
INTRODUCTION
Naegleria fowleri
and Primary amoebic meningoencephalitis
Naegleria fowleri is a free-living amoeba of soil and fresh water, which feeds of bacteria present in these environments. It also exists as a virulent pathogen causing primary amoebic meningoencephalitis (PAM) in humans, mice, and other mammals.
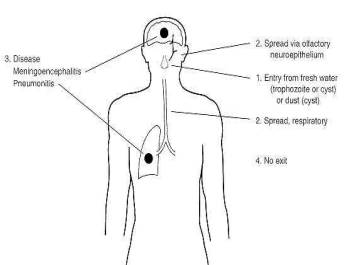
Infection of the brain occurs after amoebae reach the nasal cavity and attach to and invade the nasal mucosa olfactory nerve. Invasive amoebae able to enter the nervous system digest neuronal tissue and other mammalian cells by unusually effective cytolysis and phagocytosis as observed in culture or in sections of infected brain tissue. However, the molecular mechanisms responsible for the capacity to be pathogenic are still poorly understood.
Primary amoebic meningoencephalitis occurs in persons who are generally
healthy prior to infection. The organisms can multiply in the tissues of the
central nervous system and may be isolated from spinal fluid. Transmission is
through water based fluids or the air. Is rare in occurrence; fewer than 100
cases have been reported in the United States in the 25 years since these
diseases were recognized. Diagnosis relies on identifying trophozoites by
microscopic examination of fresh cerebrospinal fluid specimens or histological
sections of CNS tissue, and on culturing, if necessary.
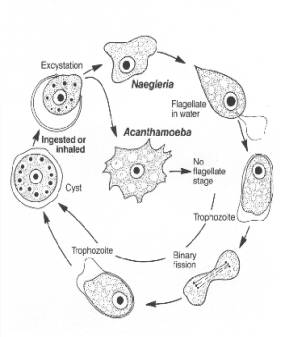
Figure 1- Multiplication and Life Cycle. Naegleria fowleri is a free-living inhabitant of fresh water and soil. The amoeboid trophozoite form reproduces by binary fission and also gives rise to the encysted and flagellated forms, which do not reproduce. Naegleria fowleri is thermophilic, preferring warm water and reproducing successfully at temperatures up to 46oC. In temperate climates, the amoebas over winter as cysts in bottom sediments of lakes, swimming pools and rivers.
Pathogenesis
The sustentacular cells of the olfactory neuroepithelium are capable of
active phagocytosis, and this appears to be the mechanism by which the amoebas
invade the body. The amoebas then travel up the mesaxonal spaces of the
unmyelinated olfactory nerve to the brain. The olfactory nerve terminates in
the olfactory bulb, which is located in the richly vascularized subarachnoid
space and is bathed by cerebrospinal fluid. The subarachnoid space is the route
of dissemination to the rest of the central nervous system (CNS).
Naegleria fowleri and
Virulence-related protein Nf314 (P42661)
Researchers
of the Department of Zoology of the Michigan State University identified
Virulence-related protein Nf314 as the protein differentially expressed in
highly virulent amoebae. Nf314 protein has a total of 482 amino acid residues.
The Nf314 cDNA has an open reading frame for 53-kDa protein 94% similar
and 19% identical over 194 amino acid residues to serine carboxypeptidases from
yeast cells, barely, and wheat.
With more information on the biology of Naegleria fowleri and Virulence-related protein Nf314, improved strategies for prevention and treatment of primary amoebic meningoencephalitis should emerge.
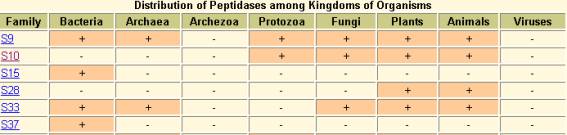
Virulence-related protein Nf314 belongs to peptidase S10 family(serine carboxypeptidase family)
 .
.
Serine carboxypeptidases
Serine carboxypeptidases are exopeptidases that efficiently remove C-terminal acids from peptides. The enzymes are inhibited by diisopropyl phosphofluoridate, a reagent specific for serine proteinases, suggesting that they have a Ser-His-Asp catalytic triad as found in the trypsin and chymotrypsin families of endopeptidases.
Specific serine carboxypeptidases are grouped into two general classes with some overlap, recently termed carboxypeptidases C and D.
ü Carboxypeptidases C most efficiently hydrolyse hydrophobic residues.
ü Carboxypeptidases D most efficiently hydrolyse basic residues.
It is known that enzymes increase the rate of chemical reactions by decreasing the activation energy of the reactions. This is achieved primarily by the enzyme preferentially binding to the transition state of the substrate. Some catalytic groups of the enzyme are required to achieve a specific reaction path for the conversion of the substrate to product.
Serine carboxypeptidases, as serine proteinases, present in the three-dimensional structure four essential features for the catalysis:
i.
Catalytic triad
Consists in the side chains of Asp, His, and Ser close to each other in the active site, although they are far apart in the amino acid sequence of the polypeptide chain.
The Ser residue is reactive and forms a covalent bond with the substrate, thereby providing a specific pathway for the reaction.
His has a dual role: primarily, it accepts a proton from the Ser to facilitate the formation of the covalent bond; and, secondly, it stabilizes the negatively charged transition state. The proton is subsequently transferred to the N atom of the leaving group.
Asp also contributes by stabilizing the positive charge of His.
ii.
Oxyanion binding site.
It is a pocket of the enzyme that stabilizes the transition state by forming two hydrogen bonds to a negatively charged oxygen atom of the substrate.
iii.
Substrate specificity pocket.
Even
though these enzymes have no absolute specificity, many of them show a
preference for a particular main chain before the excised bond. The side chain
is oriented so as to fit into a pocket of the enzyme called the specificity
pocket.
iv.
Non-specific binding site for polypeptide
substrate.
The polypeptide substrates exhibit a non-specific binding to the enzyme through their main-chain atoms, which form hydrogen bonds in a short anti-parallel b sheet with main-chain atoms of the loop region in the enzyme. This non-specific binding also contributes to stabilization of the transition state.
These four features are present in all serine carboxypeptidases even though they are achieved in completely different ways by different three-dimensional structures.
METHODS &
RESULTS
In order to build a putative 3D structure of the target protein P42661 with unknown structure, the comparative modelling of proteins has been used. The methodology is based on assembling the model from related proteins with known structure and a sequence percentage identity to the target sequence greater than 40%.
Looking
for templates: PSI- BLAST
By searching the target protein in the protein database SWISSPROT by the accession number, some interesting information about the target protein P42661 is obtained:
|
Protein Name |
Virulence-related protein Nf314 |
|
Synonim |
EC 3.4.16.- |
|
From |
Naegleria fowleri |
|
Taxonomy |
Eukaryota; Heterolobosea; Schizopyrenida;
Vahlkampfiidae; Naegleria |
|
Function |
May be required but is not sufficient for increased virulence. |
|
Induction |
By growth on mammalian cells. |
|
Similarity |
Belongs to PEPTIDASE FAMILY S10; also known as the serine carboxypeptidase family. |
|
Length |
482 AA |
|
Molecular Weight |
53848 Da |
|
FASTA sequence |
The aim of the question is how to obtain a set of templates with known structures and with high sequence homology with the target protein. The program PSI-BLAST (Position-Specific Iterated BLAST) in the local computer can be used. The blastpgp program can do an iterative search in which sequences found in one round of searching are used to build a score model for the next round of searching. The position-specific matrix for round i+1 is built from a constrained multiple alignment among the query and the sequences found with sufficiently low e-value in round i. The program “converges” and stops if all sequences found at round i+1 below the e-value threshold were already in the model at the beginning of the round.
The e-values of the homologous sequences obtained with defined structure were low enough, and then it was no necessary to repeat the query in the SWISSPROT database. The results obtained are summarized in the following table:
Name |
Physiological Dimer Hpp Precursor |
Complex of the wheat |
Saccharomyces cerevisiae |
Serine carboxypeptidase II from Baker's yeas |
Crystal structure of Kex1 |
Complex of the wheat Serine Carboxypeptidase |
|
Accession entry in PDB |
||||||
|
Accession entry in SW |
1YSC mutant |
|||||
Source |
Homo Sapiens |
Triticum aestivum |
Saccharomyces cerevisiae |
Saccharomyces cerevisiae |
Saccharomyces cerevisiae |
Triticum aestivum |
|
Length |
480 aa |
423 aa |
421aa |
421aa |
483aa |
423aa |
Chains |
A,B |
A,B |
A |
A |
A |
A,B |
|
Family |
Serine Carboxypeptidase |
Serine Carboxypeptidase |
Serine Carboxypeptidase |
Serine Carboxypeptidase |
Serine Carboxypeptidase |
Serine Carboxypeptidase |
|
Score |
254 |
157 |
137 |
132 |
113 |
89 |
|
E-value |
3e-68 |
7e-39 |
7e-33 |
2e-31 |
2e-25 |
3e-18 |
|
Exp.Method |
X-Ray Diffraction |
X-ray Diffraction |
X-ray Diffraction |
X-ray Diffraction |
X-ray Diffraction |
X-ray Diffraction |
|
Resolution |
2.20 |
2.1 |
2.8 |
2.6 |
2.40 |
2.50 |
|
Fold |
a/b-hidrolases |
a/b-hidrolases |
a/b-hidrolases |
a/b-hidrolases |
a/b-hidrolases |
a/b-hidrolases |
The templates 1ivy, 1ac5, 1cpy and 1bcr were chosen because they had an acceptable e-value (which means that they are good homologous) and they belonged to different organisms. Chain A from 1ivy and 1bcr were used because they are heterodimers and chain Ais more homologue toP42661.
3D structure of 1ivy More informatin about 1ivy
Comparative modelling using 4 templates
Multiplesequence alignment: ClustalW
Multiple sequence alignment with ClustalW was made in order to study and analyse sequence similarity between P42661 and the 4 templates. Click here to see the Multiple sequence alignment between P42661 and 1ivyA, 1cpy, 1ac5 and 1bcrA.
As we can see from the alignment, N-terminal region has no homology and does not align with the templates used. The 1bcrA template is shorter than the rest. There are other regions that do not align properly. In order to obtain the best model, a structural alignment was done.
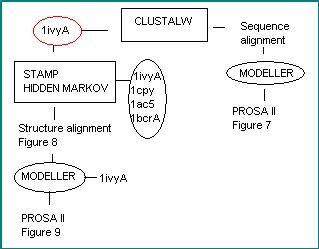
Structuralalignment: STAMP and HIDDEN MARKOV
STAMP is a package for the alignment of proteins sequence based on three-dimensional (3D) structure. It provides multiple alignments and the corresponding ‘best-fit’ superimposition. Sub-program PDBC (finds and reports information about PDB files given a four (PDB) code and/or chain identifier) is used to create the input file with all the structures to superimpose. STAMP is initially used with the option –rough to obtain an superimposition by merely aligning the N-terminal ends of the sequences and using whatever equivalences. The TRANSFORM sub-program was used to visualize with RASMOL the structure superposition created by STAMP.To introduce the output in HIDDEN MARKOV it is necessary to convert the format from vertical to horizontal with the aconvertMod.pl script.
HIDDEN MARKOVprogram uses profile hidden Markov models (profile HMMs) which are statistical models of the primary structure consensus of a sequence family. Here are the different steps: (1) hmmbuild reads structural alignment from STAMP and builds a new profile HMMs (2) hmmcalibrate reads the HMM file created and scores a large number of synthesized random sequences with it, fits an extreme value distribution (EVD) to the histogram of those scores, and re-saves hmmfiles now including the EVD parameters (3) hmmalignaligns the sequences generated by hmmbuild using information from multiple sequence alignment created by ClustalW . Afterwards, a structural alignment containing the four templates and the target protein is obtained.
The automated program MODELLER uses spatial constraints extracted from the multiple alignments of the known homologous proteins to construct the target protein by satisfying these constraints. The user provides an alignment of a sequence to be modelled with known related structures and MODELLER will automatically calculate an all-atom model. After the necessary format modifications, the information obtained by the Hidden Markov alignment is introduced into MODELLER to obtain four different models from the target protein 3D structure that satisfy these restraints as well as possible.
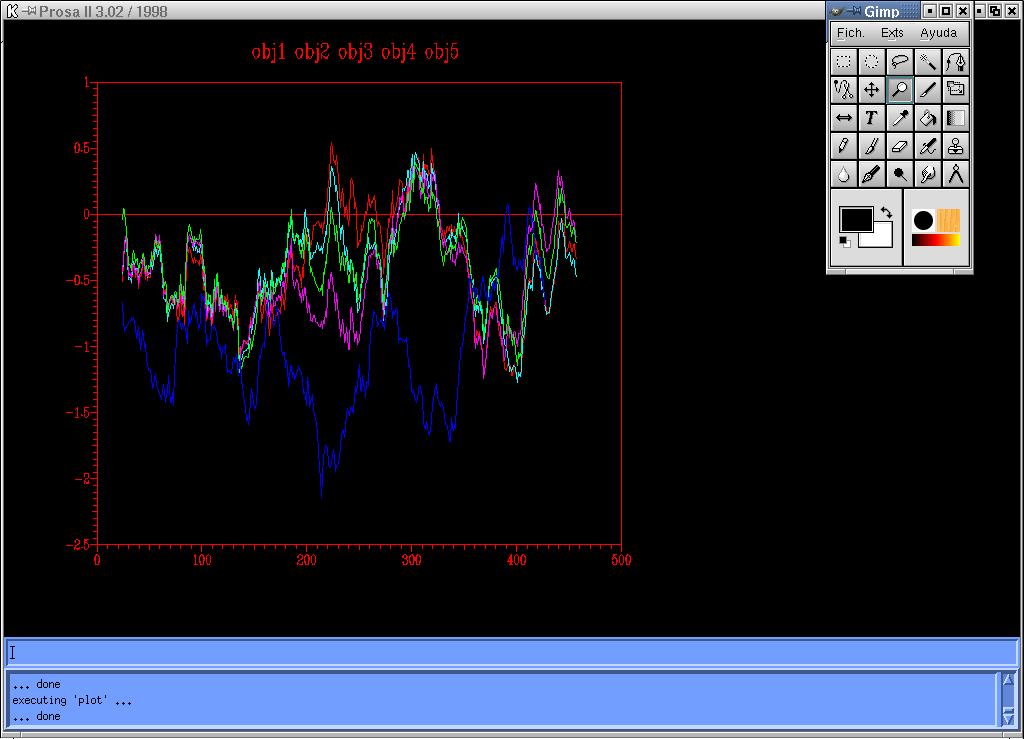
It is necessary to evaluate the accuracy of the models or at least to select the best model among several possible conformations.PROSA II is very helpful for modelling studies as it analyses the energy functions and statistic potentials of the four models created to evaluate how good they are. Energy graphs provide diagnostic tools to spot problematic sections in the structures obtained from modelling studies. Theses graphs display the energetic architecture of the proteins folds as a function of amino acids sequence position. High energies correspond to stressed or strained sections of the chain and may point to problematic parts of a fold. It is also useful to compare it with the energy of the templates used, so it can be deduced if the problematic areas are because the models are wrong constructed, or because the templates contain also these problematic sections.
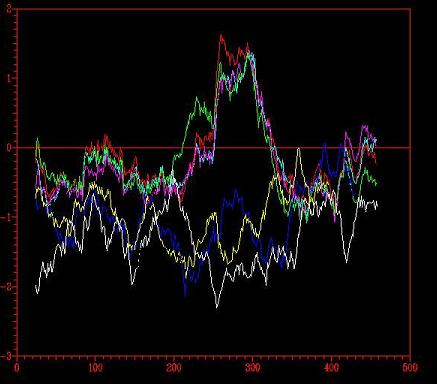
Figure 2 – Energy graph corresponding to the four models (1,2,3,4) created from four templates: 1ivyA, 1cpy, 1ac5 (white) and 1bcrA.
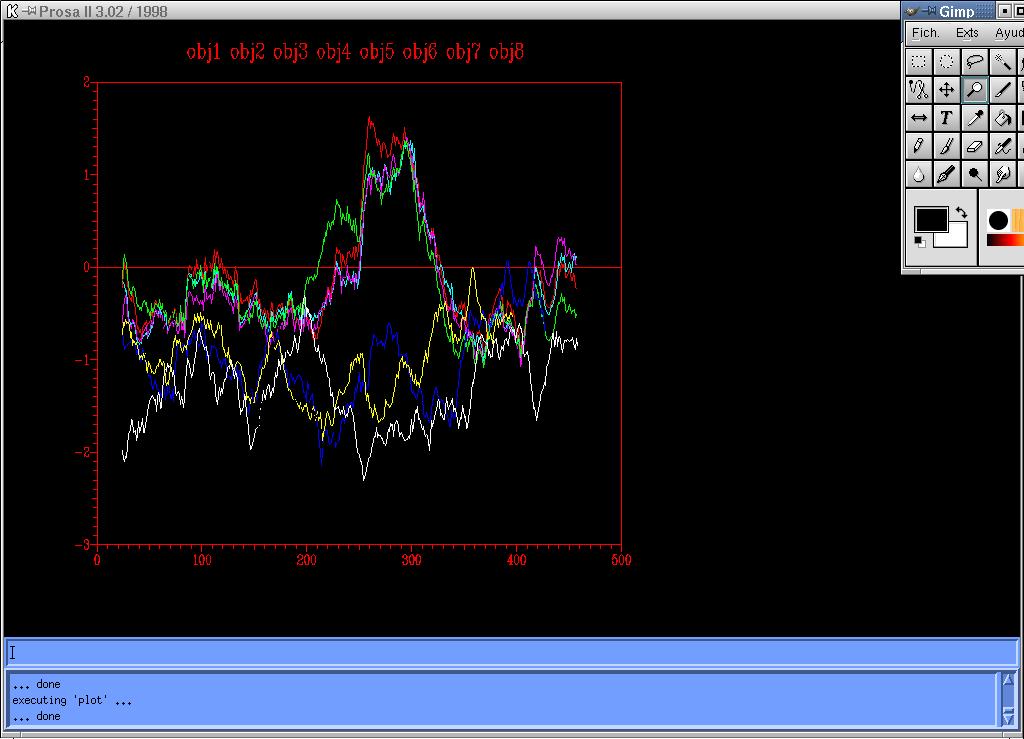
Two problematic regions are identified with positive energy picks (1.7) corresponding to the region of amino acids 200-350 approximately. Those areas are of negative energy in the four templates, therefore it can be deduced that the problematic regions are wrongly modelated and that further structural modelling is required.
New models using option –alingfit in the STAMP
It was necessary to look for another strategy to improve the models created. Searching in the bibliography of serine proteinases, it was realised that despite a pronounced functional similarity (a highly conserved catalytic triad), this family of proteins shows little overall sequence similarity. Indeed, sequence alignment methods generally fail to provide an accurate alignment of these protein sequence (as seen in Figure 1). In situations like these, STAMP can be used to provide an accurate alignment of protein sequences based on a comparison of 3D structure. This often reveal region of weak sequence similarity that are not detectable during a comparison of sequence. The option-alignfit takes a multiple sequence alignment of proteins of known 3D structures and uses it to superimpose them, taking only into account the 3D structure.
As the four templates used had relatively low sequence similarity, this option might be useful to improve the models and get better energy graphs. The process was repeated using STAMP –alignfit, creating a new hidden markov profile, and running again MODELLER with this new information. The results were evaluated with PROSA II.
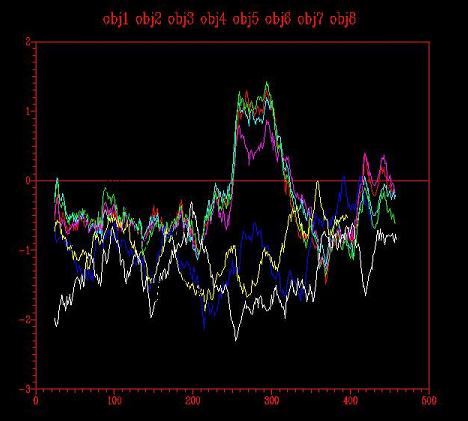
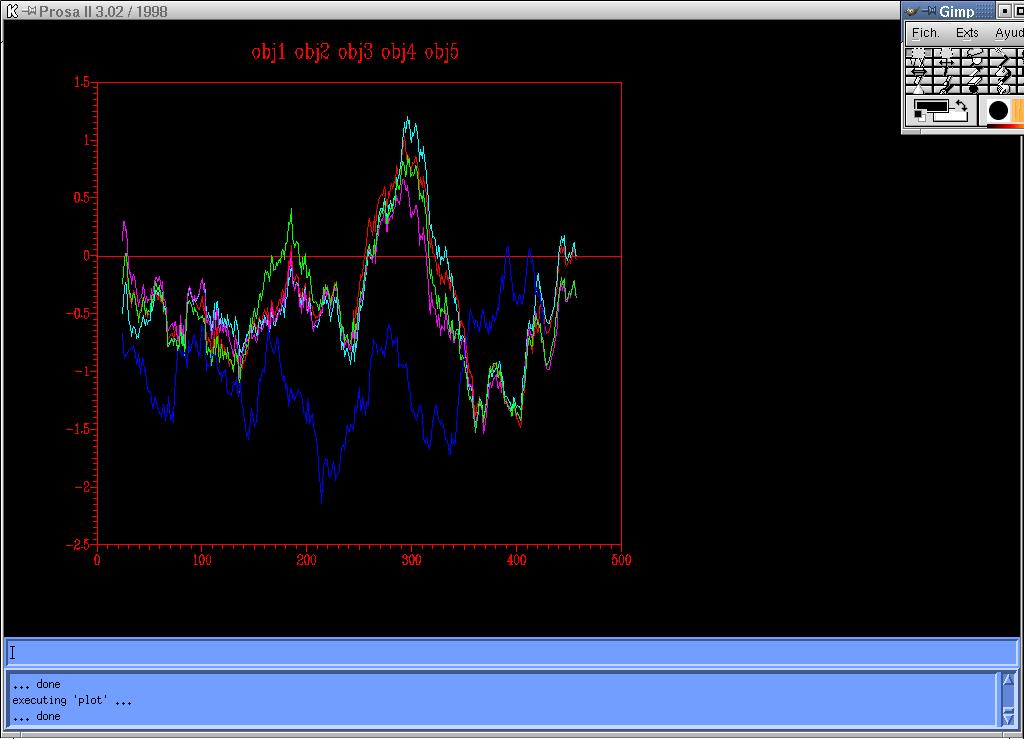
Figure 3 - Energy graph corresponding to the four models (1,2,3,4) created from four templates: 1ivyA, 1cpy, 1ac5 (white) and 1bcrA
Unfortunately,
the results obtained were not as good as expected. Little improvement is shown
with respect to the previous step.There are still two problematic sections with
positive energy (1.4), however, the maximum value is lower. These regions
should be better modelled with the templates that had been chosen.
Comparative
modelling using 2 templates
After the analysis of the results obtained with 4 templates, another path had to be followed. Looking at the multiple sequence alignment (Figure 1) it was realised that 1bcrA and 1ac5 were the most different templates in terms of sequence homology. Intuitively, it was considered that other models originated from the templates 1ivyAand 1cpy should be better.

Methodology used to obtain structural models from 2 templates.
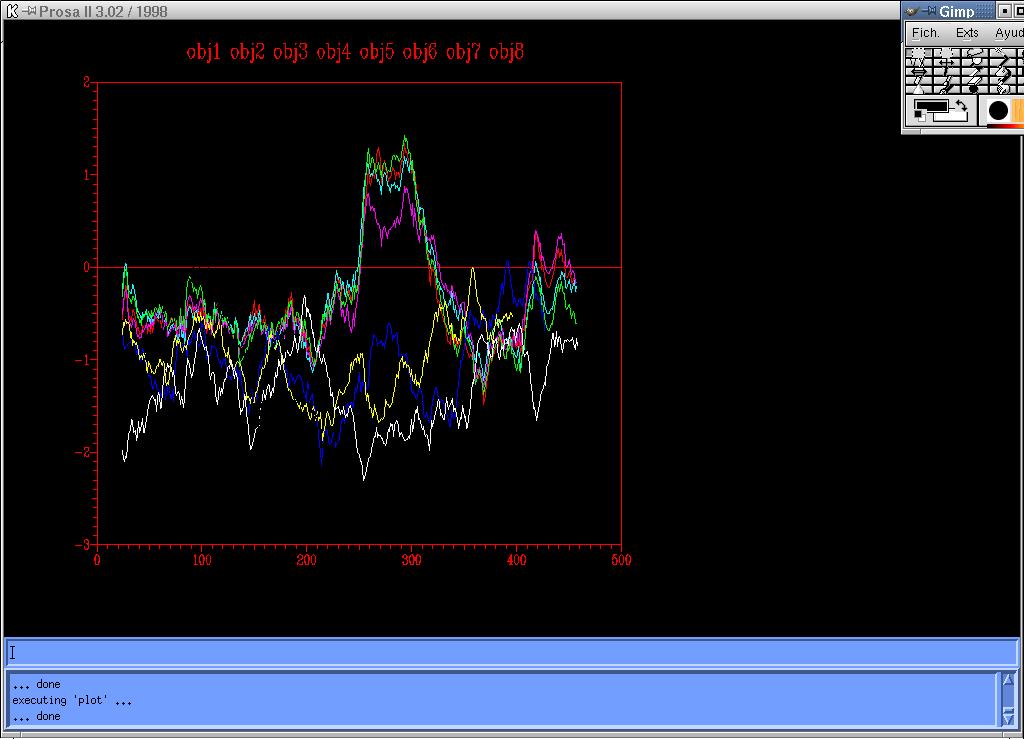
From the analysis of the energy graphs (Figure 4-5) obtained following the two different ways indicated in the summary diagram below,it was determined that both graphs were equal, so in this case, there was no improvement using the option –alignfit. There were still the same two problematic regions with positive energy, although, the maximum value was lower (0.8).
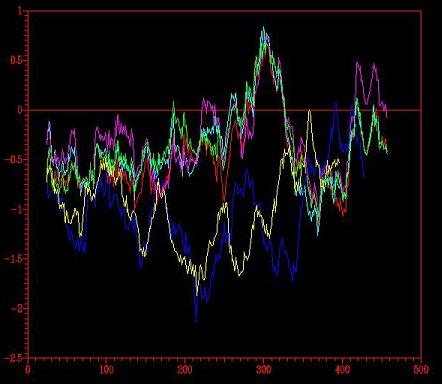
Figure 4-5 Energy graph corresponding to the four models (1,2,3,4) created from two templates: 1ivyA and 1cpy.
Even though there are still two major problematic sections in the energy graphs of the models generated, the results are better than the ones obtained using four templates.
Comparative Modelling using one template
In order to decide which template was the most informative in the problematic section identified with PROSA II as the region between amino acids 282 and 325 approximately and the one with less gaps along the alignment, the analysis of theClustalW results between 1ivyA, 1cpy and P42661 is required. Click here to see the Multiple Sequence Alignment.
The general out view of the alignment shows that the template 1ivyA is more informative and has less gaps, which is confirmed by the literature, because 1ivyA is the human homologous of P42661 and has an 80% sequence homology. Thus, the comparative modelling was done using only this template.
As seen in the methodology diagram, the second path followed uses the information ofthe Hidden Markov profile built with the four templates 1ivyA, 1cpy, 1ac5 and 1bcrA. When running MODELLER, only the 1ivyA sequence is used as template but with the background structural information of all the other templates.
Methodology used to obtain the models from one template.
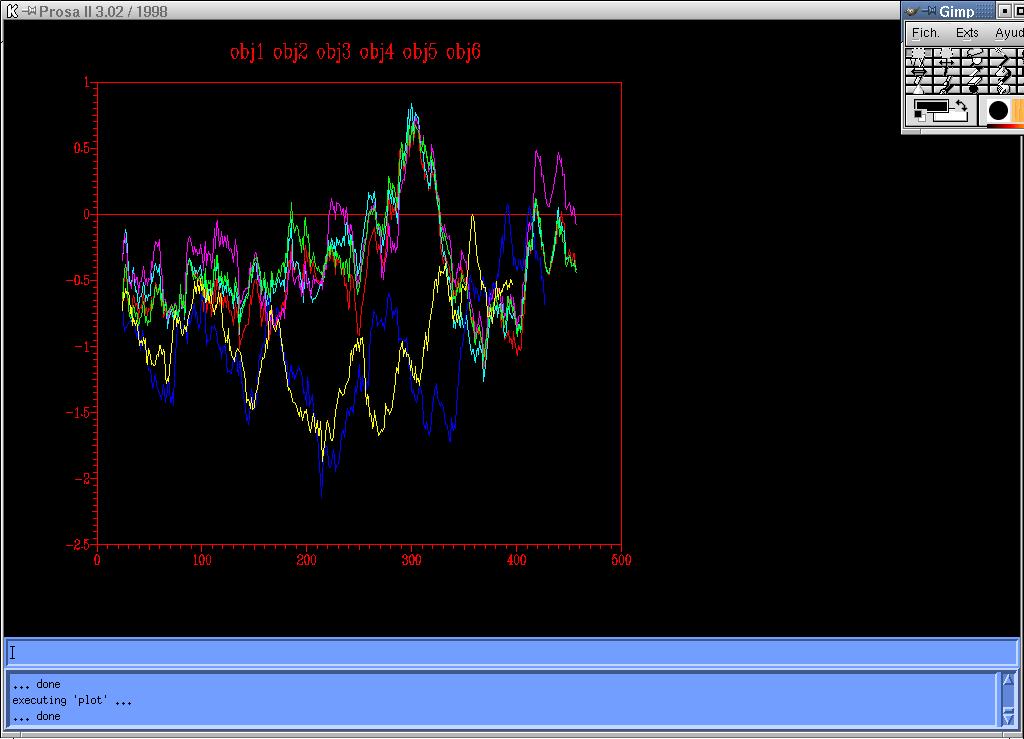
The analysis of the energy graph (Figure 7) resulting from the four models constructed with the sequence information of 1ivyA, reveals, as expected, that the sequence alignment does not give much information for a precise structure modelling. The positive energy pick is observed at 1.25, and although it is a quite high value, it is still lower than the maximum value obtained with four templates.
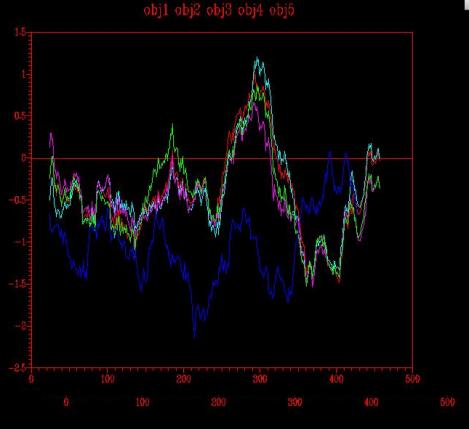
Figure 7 -Energy graph corresponding to the four models (1,2,3,4) created from one template: 1ivyA
To create a structural model of the target protein from the best template, 1ivyA, and taking into account the structural information given by the four templates chosen at the beginning of the modelating process, the best strategy is to use the structural alignment (Figure 8) of P42661, 1ivyA, 1cpy, 1ac5 and 1bcrA, done with STAMP+Hidden Markov, and indicating MODELLER to take just the 1ivyA sequence to build the structural model.
The analysis of the energy graph (Figure 9) obtained is finally satisfactory. The maximum positive energy values correspond to a region of 0.5 which is not well enough modelled by the template. It is also interesting to observe that there is another positive energy region on the C-terminal end of the protein, but it is important to see that this region could not be better modelled because the template has also positive energy in this area. It probably corresponds to a variable region along the carboxypeptidases family.
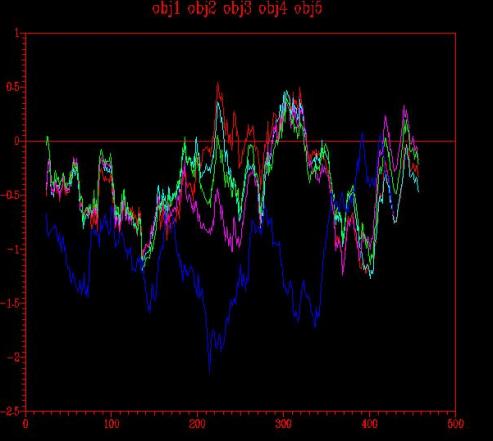
Figure 9 - Energy graph corresponding to the four models (1,2,3,4) created from one template: 1ivyA
Comparing the four models between each other, it is rapidly seen that the third model created, coloured with magenta, is better than the rest as it has the lowest energy values along the structure. In the problematic area, this model is also the one with less positive energy. Therefore, the third model is chosen to follow with the optimisation of the structure model of P42661.
Click here to visualize the third model
By superposing the structures and
visualizing the superposition with RASMOL, the problematic region
between amino acids 282 and 325 approximately, was identified as a large loop.
The fluctuating areas of the models that are most conflictive,one loop in the central
region, another loop in C-terminal and the N-terminal region, should be checked
in the analysis after the optimization.
Click here to visualize the four model superposition
In order to analyse the positive energy picks observed in the models, including this putative loop, Secondary Structure Prediction methods were used. The actual methods of secondary structure prediction (about 70% accuracy) can be very helpful for checking a model built structure, mainly because the misalignments on the loop regions could be related with erroneous secondary structure assignment for the model.
Results of secondary structure prediction
The results from the secondary structure prediction, showed that the problematic central region corresponded to a putative loop rich in Pro, which makes it even more difficult to modelate. After identifying the problematic region (282–325 amino acids) as a loop, it is generally used the Loop DataBase to modelate it. The point is that with such a large loop, it was impossible to find a similar loop in the database. This region has to be accepted as a loop and no more strategies to improve it were done.
Improvement of the Model
Molecular
Dynamics enables the study of the molecule movements at the atomic level using
a computational simulation. At this moment the dynamics with the third model of
the protein Nf314 created by Homology Methods was done. The objective of the
dynamic is to minimize the conformational energy of the structural model. The
secondary structure that the model has adopted is not expected to change, what
it is expected to change is the interaction between residues in order to
diminish the total potential energy of the model.
The
dynamics can be run with GROMOS program but it is complex to use, so
GRUMUS, a GROMOS iterfice is indicated. Dynamics allowed the user to explore
the conformational space of a protein model.
Topology
This
option reads a pdf file. It allows the user to decide if the model
should have disulphide bridges (it is possible to change the name of the
residues but only when they belong to the same residue, for example, the Nf314
model was determined to have one disulphide bridge between Cys 71 and Cys 365,
so the name of both residues should be changed to Cys1 and Cys2 respectively).
It is also possible to chose between other topological features as to do the
simulation with water molecules in the solvent or with the non-inertal solvent.
The option “Create Input” creates another gsf file and the input to run
the topology option.
Optimization
The input
files for the optimisation are the output files in gsf format of the
topology. The optimisation can be done by different geometry methods, the steepest descent method was
chosen.
The
program is run several times, each run involving several steps and with each
step a new set of coordinates are obtained. The number of steps to get a new
set of coordinates can also be chosen in each run. The program allows the user
to make the calculus of the electric energy and Van der Waals energy with
different methods, the one chosen is by interactions of previous selected group
pairs inside a further specified residues. The program also asks for the radius
value of cut-off and cut-on. The parameters given by default were selected.
After, the shape and size of the box with the option no-periodicity was
selected. The program runs with some constrains referred to the strength and
the distance between atoms.
Theoretically,
when the dynamic is done, the energy is reduced to the minimum value, because
the molecular model is stabilized into the most relaxed state. The system is
let to “fall” to its most relaxed state and during this process some of the
conformational intermediate states are explored.
In order
to evaluate the process of optimisation, the energy plots of the first out file
of optimization, which is the less relaxed, supposed to be the one with highest
energy and the less stable, with the last out file, which is supposed to be the
best one in energetic terms. To evaluate this comparison the energy of both
files is analysed with PROSA II, which confirmed the expectations ( the optimised
model has lower positive energy picks).
To evaluate the files PROCHECK can be used.
Procheck summary of the no optimised model.
Ramachandran Plot of the no optimised model
Procheck summary of the optimised model
Ramachandran plot of the optimised model
Ramachandran plot of each amino acid (optimised model)
Taking a
look to the summary procheck of both files, it can easily be seen that the no
optimised model is worse in terms of energy; it has 15 bad contacts, in
contrast to the optimised file that has 0 bad contacts. The information from
the Ramachandran plot represents with the angles f and y of the
protein model.
Dynamics
The
dynamics was run with the most optimised file, corresponding to the most
relaxed model. The simulation of the dynamics runs the program several times,
depending on how long the user wants to patch the trajectory. The user can
decide also how long each run will be. The output of the program is made along
each run and it will keep the information from the velocity of the centre of
the mass and the RMSD (desviation from mean coordinates) average desviation.
The coordinates and the energy along the simulation will be kept every X ps
(picoseconds), which is decided by the user.
To run the
simulation it will be necessary to define physical parameters like the
temperature.
Analysis of Dynamics
Analysis of the
B-factor
The
analysis of the B-factor allows the study of the fluctuation of the model. The
methodology consists of varying the temperature during the simulation. The
regions that are less stable fluctuate more if the temperature is increased and
the regions best modulated, more stables, fluctuate less or don’t vary when the
temperature is increased. The molecule flexibility can be due to (1) a
structural inconsistence of the model (2) a structural requirement for the
protein function (3) a domain that will be excised in the mature protein and
thus is not submitted to structural and/or functional restrictions.

If we
analyse the results of the B-factor, three regions appear with high fluctuation
while the rest of the residues are less fluctuating:
-
The first region corresponds to the residues of the N-terminal part of the protein. High-energy values
in this region were expected because no sequence similarity in the alignment
with the template was obtained. The analysis with PROSA II also
indicates that the N-Terminal is a problematic region as it has positive energy
values in the energy graph.
-
The second region that fluctuates more than the mean fluctuation
corresponds to the residues 230-260
approximately. From the literature (More informatin
about 1ivy) this region could correspond to a loop in a putative maturation
domain of Nf314. The hypothesis is that this region is three-dimensionally
located in order to block the substrate accession to the active site of the enzyme.
To activate the catalytic function of the enzyme, this region will be excised
from the protein and will not be present in the mature form, which is an interesting
maturation mechanism. This hypothesis explains the fluctuation as the region has
less functional or structural restrictions.
- The third region
with high energy level corresponds to the residues 415-450
approximately. This region is a loop in the C-terminal
part that already appeared to be variable when the different templates were
superposed with Nf314 protein and visualized it with RASMOL. The PROSA
II energy graphs also indicated the existence of a problematic region with
positive energy values.
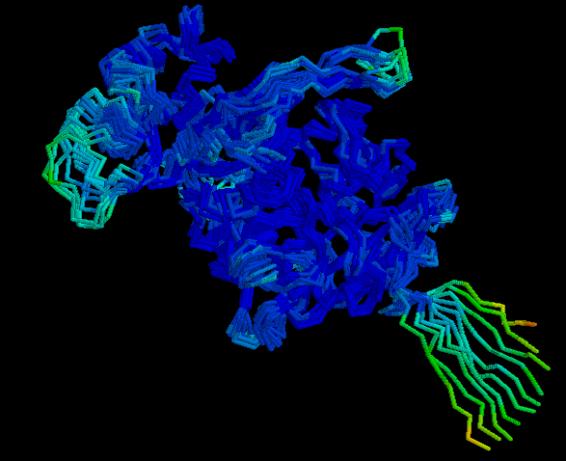
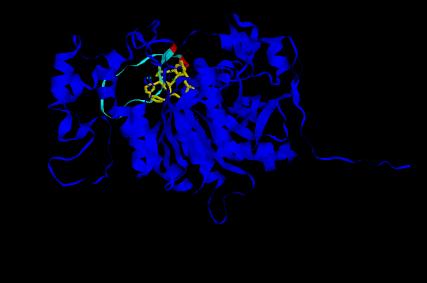
Analysis of the most stable regions
Next image presents a RASMOL visualization of some of the files obtained from the analysis of the dynamic. The image has been done with the display temperature. Blue areas show the less variable regions when the temperature is increased, therefore the most stable ones. In lighter blue and green, as well as in warmer colours (red or yellow), appear the regions of the protein model that fluctuate the most when the temperature is increased. These regions were previously identified with the B-factor analysis as the less stable; corresponding as expected, with the most fluctuating regions as the temperature is increased.
Analyse of the fluctuation regions by
RMSD
The
summary of the RMSD shows that the fluctuation increases when the temperature is
elevated. It could seem that the global model has high fluctuation values but
if the detailed file is studied carefully it can be seen that the high RMSD values
are restrained to three local regions.
Click here to
see the detailed profile
The values
of the BB (global) factor, which is the standard deviation of the position of
the atoms of the backbone, that appear in the profile below also inform about
the fluctuation of the model. The regions of the model with high value of BB (global)
are the same ones that have been previously identified with the B-factor
analyse and the temperature analyse.
-
N-terminal region (residues 1-16) has BB (global) values
from 2 to 9.5. These values are the highest of the model and reflect the high fluctuation
consistent with the fact that no sequence similarity in the alignment with the
template was obtained.
-
The residues corresponding to the loop of the maturation
subdomain (residues 230-260) have BB (global) values from 2 to 5, which is not
as high as the values of the N-terminal residues but higher as the mean BB (global)
value of the model.
-
The residues of the C-terminal loop (residues 415-450) have
BB (global) values similar than the residues of the loop of the maturation
subdomain (values from 2 to 5).
Energy profiles of the model
That plot
made with PROSAII shows a comparison of the energy profiles of the model
before the dynamics and after it. Surprisingly the optimised model presents
higher energy values than the no-optimised one. One explanation could be that
the dynamics induces changes over the whole model: it can improve the regions
with high-energy values associated and consequentially improve the quality of
the model, but it can also vary the regions that were already good modelated and
consequently diminishes the global model accuracy. This hypothesis fits with
the results obtained.
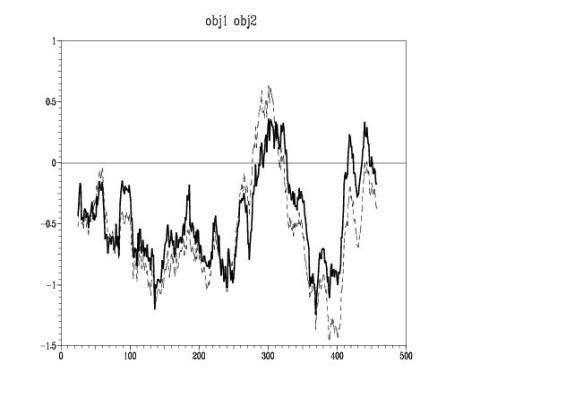
Energy Graph – Protein model before optimisation ( ) and after (------).
Click here to see the superposition
Model + Inhibitor
During the search of accurate templates to perform the comparative modelling, the existence of a serine carboxypeptidase template complexed with an inhibitor molecule was realised. The template 1bcs is a complex of the wheat serine carboxypeptidase, cpdw-II, with the microbial peptide aldehyde inhibitor, chymostatin, and Arginine at 100K of Triticum Vulgaris. The aldehyde inhibitor, chymostatin, is identified in the pdb file with 500 CST. The inhibitor blocks the catalytic activity by occupying the active site cleft and inhibiting the substrate binding.
An interesting work to do was to superpose the structures of the template + inhibidor and the Nf314 model in order to determine if the interaction between the model and the inhibitor was similar to the interaction with the template. A positive result would give more evidences to the putative Nf314 model.
The methodology consists of a superposition between the most conserved areas (this is without gaps) of the template and the model using XAM. The output file showed a RMSD of 1.35, which indicates that both structures superpose well.
Click here to see the output file.
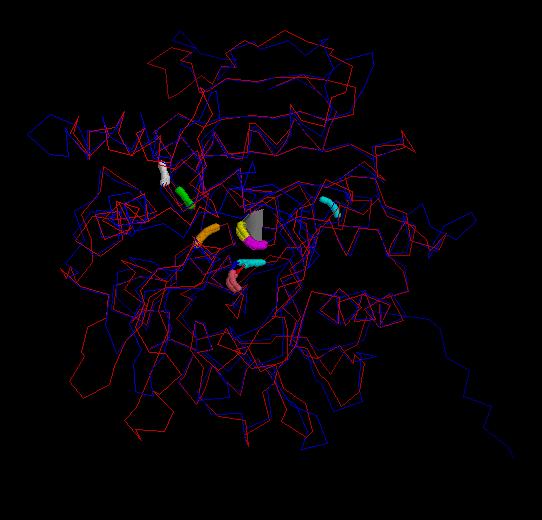
In the superposition, the Nf314 model is coloured in blue, the 1bcs template in red and the inhibitor peptide, corresponding to residue 409, is coloured yellow. As it can be seen in the figure, the inhibitor within the template occupies the same position as the region 305-327, corresponding to the central loop, in the Nf314 model. This observation might have some implications for the catalytic Mechanism and substrate specifity of Nf314.
Click here to see the superposition.
By eliminating the atoms of the template in the pdb file of the superposition, a pdb file with the model and the inhibitor is obtained. The visualization of these pdb file with RASMOL enables to see that the peptide inhibitor is located in the active site cleft of the Nf314 model, which evidences that the active site of the model is similar and permits similar bindings of inhibitors/substrates as the template.
In the image below the Nf314 model with its active site ( Ser 163, His 459, Asp 399) , the central loop
(residues 305-326) and the flanking residues
of this loop (residues 304-305 and
residues 326-327) is shown. The inhibitor peptide (residue 409) is located in
the active site.
Secondary Structure
Nf314 belongs to the a/b-hydroase fold family, which
includes enzymes with different catalytic functions apart from the serine
carboxypeptidases. This
protein has a 94% similar sequence to the known serine carboxypeptidases.
The model obtained is a monomer, but basing on the study of homologous proteins that have been already crystalized and basing on functionary studies, it is supposed to form a dimer to be active.
The
protein fold (a/b hydrolase-fold) can be divided into two domains:
1. CENTRAL CORE domain: it is the most conserved part of
the protein in relation with the other members of the family. It is formed by a
central b sheet
flanked by ahelices on both sides. The central b sheet contains 10-bstranded (b-strands 1, 2, 3, 6, 7, 8, 11, 12,
13, 14). In addition to this central b sheet ten a
helices (helix number 2, 3, 5, 9, 10, 11, 12, 13, 14, 15 ) and two small b
strands (b-strand 4 and 5) occur on both sides of the central b sheet.
2. CAP domain: it can be divided into a helical sub
domain and a maturation sub domain.
The
helical sub domain consist in three a helices (three-helix bundle) which
forms one wall of the active site cavity. It is formed by helix-6 (residues
202-215), helix-8 (residues 267-282) and helix-7 (residues 225-232). As it can
be easily seen, these three alpha helices are together in the primary structure
so the helical sub domain consists in residues 202-282.
It
has also a maturation sub domain consisting in a loop flanked in the primary
sequence by two-stranded bsheet: b-strand-9
(residues 304-305) and b-strand-10 (residues 326-327). This
maturation sub domain differs from the maturation sub domain of most of the
homologous proteins studied, that consist in three-stranded b-sheet.
The Nf314 sequence is shown in comparison to other serine carboxypeptidases from other organisms and it has in general high similarity and identically to the other sequences. There is a central area of high sequence homology, but amino acids 1 through 18 of the N- terminal part, and the last amino acids of the C-terminal part show negligible sequence homology. This could explain why the N-terminal end of the model created presents such fluctuations when the dynamics of the model done. Most members of the family have large and mostly a -helical insertions near the core fold. Referring to the variety in the C-terminal loop, it has been published (Endrizzi JA et al. ) that the largest insertion domain tends to occur in loops at the C-terminal part of the parallel b-sheet, adopting completely different folding patterns in the various hydrolase fold enzymes. It can be hypothesized that this large loop is functionally important for the recognition of the peptide substrate, which could explain the variability.
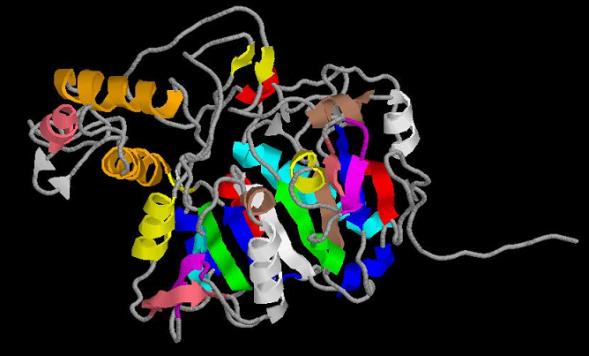
As
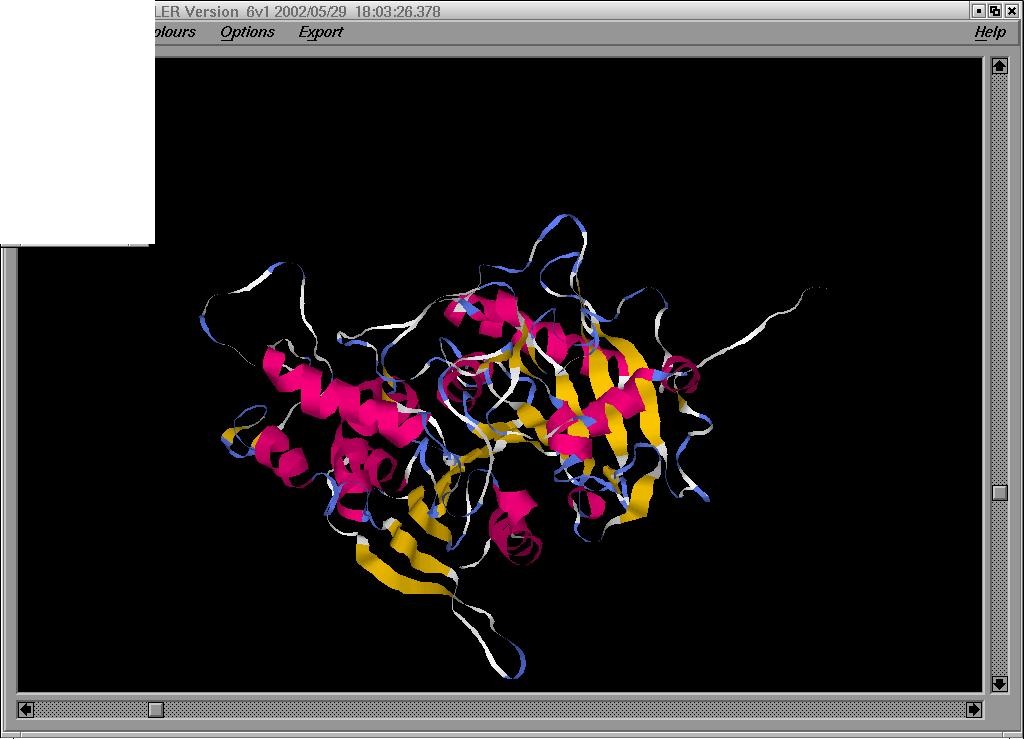
it can be seen in the image, the monomer contains approximately 50% a-structure and 50% b-structure, which is coherent with
the % of secondary structure described in other templates.
Click here to see the model
coloured by structure.
One
disulfide bridge in the monomer is identified between Cys71-Cys365. This disulfide bridge is conserved
in known serine carboxypeptidases sequences. In homologous proteins as 1ivy,
this disulfide bridges connect secondary structure elements forming the active
site cleft. However, in the model, the disulfide bridge connects two amino
acids that adopt a form like a b-strand but which are too short to be
considered as it. This disulfide bridge, as can be seen in the image below, is near
to the catalytic triad of the active site. It can be assumed that in Nf314,
this disulfide bridge also plays a role in the active site cleft. It is located
at the edge of the active site, close to the nucleophilic Ser163 and is
probably important for catalysis, for example, by stabilizing the disturbed
main chain of active site residues that interact directly with the substrate.
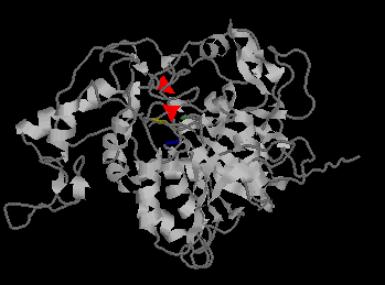
In this image, the Cys implicated in the disulfide bond are colored
in red. The amino acids of the catalytic
triad are also colored in order to make evidence that the disulfide bridge is
close to the active site: Ser163 in blue, His494
in green and Asp399
in yellow.
It
has not been yet described if Nf314 forms a dimer or if it actuates as a complex
with other proteins. The hypotesis is that it forms a dimer because the most
homologous proteins act as dimers, frequently as heterodimers. In 1ivy protein,
the cap’s domain (helice 1, helice2 and two loops) and the core domain (helice
8, b strand 10 and b strand 11) contribute equally to form the dimer interface.
There are several residues in the homologous templates described to play a crucial
role in the dimer interface. Some of them interact with their contra part from
the other monomer, and others fit in the hydrophobic pockets. Unfortunately, it
has not been possible to describe these residues in Nf314 model.
A
big loop has been identified (residues 282-325), where major structure
rearrangements occur. Some of the extreme residues may be correlated with
substrate recognition after the rearrangements and excision of the loop. There
is no recognizable sequence similarity between these residues and the equivalent
residues of the template used, although certain key residues are conserved (coloured
in green). This loop forms part of the maturation domain, which will be excised
in the mature protein. This observations could explain its high variability.
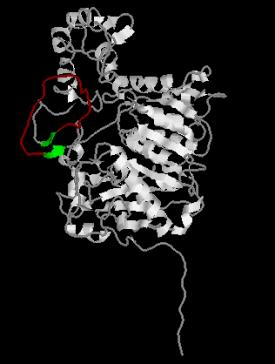
Figure – The residues that flank
the loop (residues 304-305 and 326-327) are colored green
and the residues of the loop (residues 306-325) are colored red.
Enzymatic Mechanism
The Nf314
model has all the elements proposed for the enzymatic machinery of the serine
carboxypeptidases: the catalytic triad, the oxyanion hole and the residues that
regulate the pH.
|
|
Catalytic
Triad |
Oxyanion
Hole |
pH
regulator |
|
1ivyA |
Ser 150 – His 429 – Asp 372 |
Gly 57
– Tyr 151 |
Asn 55
– Glu 69 – Glu 144 |
|
Nf314
|
Ser 163 –
His 459 – Asp 399 |
Gly 68-
Tyr 164 |
Asn 66
– Glu 80 – Glu 162 |
Click here to see the enzymathic machinery
image.
The catalytic
triad in the active site of Nf314 has been proposed to be formed by the
residues Ser163, His459 and Asp399.The
oxygen of the Ser163 forms a hydrogen bond with the nitrogen of the His459. The
residues comprising the catalytic triad are positioned by a unique fold and are
in a different order in the linear sequence in different proteins families.
The oxyanion
hole proposed to stabilize the negatively charged tetrahedral intermediate
in serine carboxypeptidase is formed in this protein by the backbone amides of Gly68 and Tyr164.
The atoms of the catalytic triad residues plus the oxyanion hole amides from
1ivy superpose correctly with the atoms of Nf314 model.
Serine
carboxypeptidases exhibit maximum carboxypeptidase activity between pH 4.0 and
pH 5.5. In some enzymes the activity is pH depenent. In Nf314 Glu80, Glu162
and Asn66 are conserved between 1ivy,
1cpy and other templates. They are implicated in the optimum pH regulation (pH
4.5-5.5) for the carboxypeptidase activity, in contrast to the serine
endopeptidases which are inactive below pH 7. These residues are positioned
near the catalytic triad. The carboxylate groups of the Glu are supposed to
interact with each other by forming an hydrogen bond. They lie at the bottom of
the active site. The hypothesis is that at least two of these groups must be
protonated to permit binding to occur. The deprotonation induced by high pH
would disrupt peptide binding due to electrostatic repulsion. The Asn66 is
oriented in such a way that it forms a hydrogen bond with each of the two carboxylates
groups of the Glutamic Acid pair.
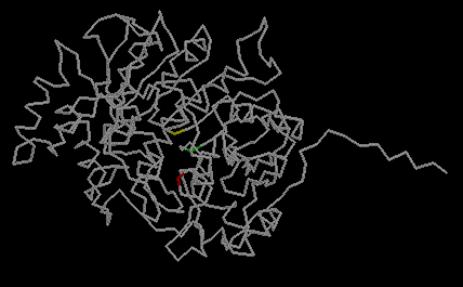
Figure – The image shows the three amino acids that regulate pH: Asn66, Glu80
and Glu162. Acidic pH is necessary for
carboxipeptidase activity.
Liao
et al. have
suggested, from biochemical data of the 1ivy homologous protein, that a
functional group with an apparent pKa value of pH 5.5 binds to the C-terminal
carboxylate of the peptide substrate and is responsible for the observed pH
optimum. They also suggest that at pH 5.5 or below, one or both Glutamic Acid
residues must be uncharged, while at higher pH deprotonation of one or both of
the carboxylates may result in unfavourable electrostatic interactions. This
would disturb the hydrogen-bonding pattern or result in structural
perturbations causing the increase in Km for peptide substrates that they
observed.
In
other serine carboxipeptidases C, several residues have been described to form
hydrophobic pockets (Asp 64 and Tyr 247 in 1ivyA) that accommodate hydrophobic
side chains of the substrate (substrate recognition). The correspondent residues
in the model have not been identified.
Proposed maturation mechanism
A proteolytic
cleavage of the precursor form of the 1ivy protein, that involves removal of a
2kDa excision peptide and that results in the carboxypeptidases activity, has
been described. This sub domain probably fills the active-site cleft. Merely
removing the "excision" peptide located in the maturation sub domain,
the catalytic triad becomes accessible to the substrate. A maturation sub
domain blocks the active site and the activation must be a multi-step process
involving removal of the excision peptide and major conformational changes of
the maturation sub domain, where the conformation of the enzymatic machinery is
probably almost, or completely, unaffected. This mechanism can also be applied to
Nf314.
As it can be seen in this image, the inhibitor fills
the active site of the Nf314 model. The hypothesis is that the model is from
the immature form of the protein, which has a maturation domain that blocks the
substrate to reach the active site, and in this case, that coincides with the
inhibitor.
This work
has been supported by GRIB, especially thanks to Baldomero Oliva, Núria Centeno
and Jordi Villà.
1. Rudenko G, Bonten E, d'Azzo A,
Hol WG.Three-dimensional structure of the human 'protective
protein': structure of the precursor form suggests a complex activation
mechanism.Structure 1995 Nov 15;3(11):1249-59.
2. Hu WN,
Kopachik W, Band RN.Cloning and characterization of transcripts showing
virulence-related gene expression in Naegleria fowleri. Infect Immun. 1992
Jun;60(6):2418-24.
3. Endrizzi
JA, Breddam K, Remington SJ.2.8- Å structure
of yeast serine carboxypeptidase. Biochemistry 1994 Sep
20;33(37):11106-20.
4. Bullock
TL, Breddam K, Remington SJ. Peptide aldehyde complexes with
wheat serine carboxypeptidase II: implications for the catalytic mechanism and
substrate specificity.J Mol Biol 1996 Feb 9;255(5):714-25.
5. Liao D I,
Breddam K, Sweet B, Bullock T, Remington SJ. Redined atomic model of wheat
serine carboxypeptidase II at 2.2 Å resolution. Biochemistry 1992 31:
9796-9812.
6. Brandem C,
Tooze J. Introduction to protein structure. 2a ed. Garland Publishing 1998.
7. Patrick
GL. An introduction to medicinal chemistry. 2a ed. Oxford University Press
2001.
8. Naegleria fowleri and other
amoebae.