iFrag Help Page
iFrag server exploits known 3D complexes (blastPDB) and protein-protein interaction networks (iFrag) with minimal sequence similarity searches to predict possible binding regions between two proteins.
Input
The input consists on the two sequences of the pair of proteins in FASTA format.
Example:
>SEQUENCE1
MGNLFGRKKQSRVTEQDKAILQLKQQRDKLRQYQKRIAQQLERERALARQLLRDGRKER
AKLLLKKKRYQEQLLDRTENQISSLEAMVQSIEFTQIEMKVMEGLQFGNECLNKMHQVM
SIEEVERILDETQEAVEYQRQIDELLAGSFTQEDEDAILEELSAITQEQIELPEVPSEP
LPEKIPENVPVKARPRQAELVAAS
>SEQUENCE2
MAMSFEWPWQYRFPPFFTLQPNVDTRQKQLAAWCSLVLSFCRLHKQSSMTVMEAQESPL
FNNVKLQRKLPVESIQIVLEELRKKGNLEWLDKSKSSFLIMWRRPEEWGKLIYQWVSRS
GQNNSVFTLYELTNGEDTEDEEFHGLDEATLLRALQALQQEHKAEIITVSDGRGVKFF
Methods
iFrag
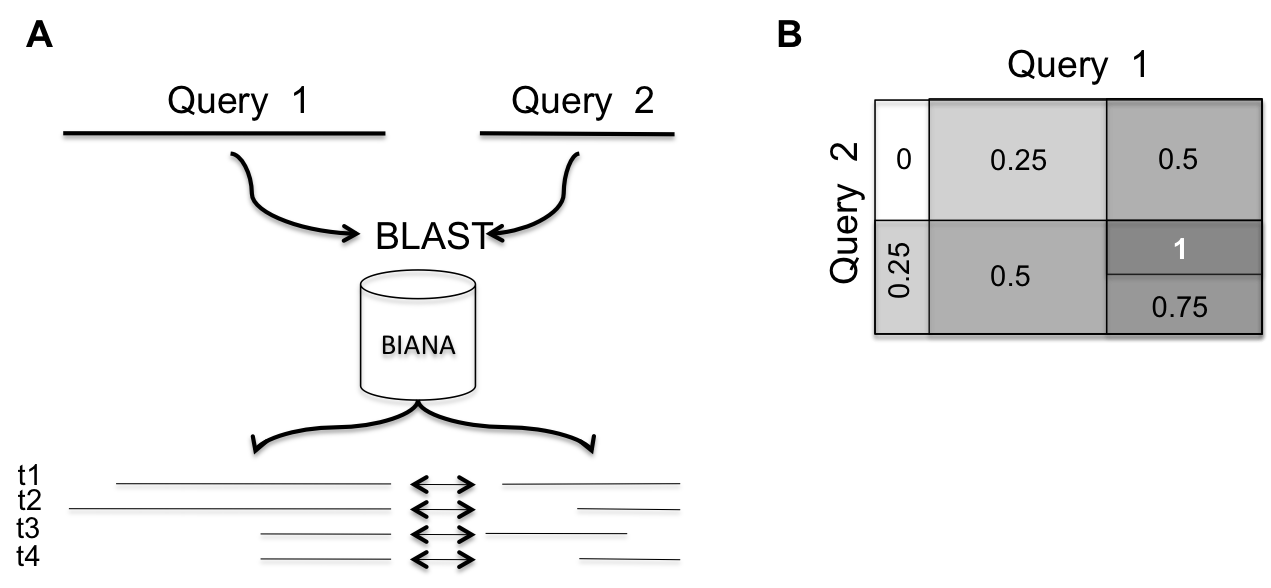
Query proteins are searched using BLAST againstall sequences with known interactions in the BIANA database. Template protein-protein interactions be be filtered to only binary protein-protein interactions (i.e. co-complex derived interactions can be excluded). BLAST e-value threshold and sequence coverage can be modified to allow the retrieval of very short fragment alignments. Matched protein fragments for query sequences are ordered so that each pair of fragments belong to a known interacting protein pair in the BIANA database. To avoid having redundancy in template protein-protein interactions, we only consider a subset of the template interacting proteins so that any pair has more than 40% of sequence identity with any other pair in the set (obtained with CD-HIT). Protein residue pairs between the two query proteins are weighted according to the proportion of paired blast matches covering that pair of residues over the total number of interacting protein pairs retrieved. Interestingly, the server does not make any assumption about protein
domain composition.
Example:

A. Two query proteins are blasted against sequences known to have reported interactions. Matches are aligned so that paired sequence fragments belong to known interacting proteins (template interactions). The set of template interactions is reduced so that it does not contain any pair of template proteins with more than 40% of sequence identity. In this example, the total number of template interacting proteins is 4. B. The iFrag score is calculated as the proportion of BLAST matches covering two residues, one in each protein, over the total number of known interactions.
blastPDB
Predicted residue-residue contacts between the two query proteins is based on homology to known structure complexes. This is the strategy used in homology modeling of protein complexes. Query sequences are aligned using BLAST with proteins from the PDB database. In case there is a match between two template sequences having contacting residue pairs, these contacts are transferred to the query proteins using their pair-wise alignment. Different sequence identity thresholds can be applied to remove remote homolog templates by excluding those matches having a sequence identity percentage lower than the threshold.
Output
There are two outputs:
iFrag output: predicted scored contact map (represented as a heat-map image) using the iFrag approach. Predicted interacting regions can range from short fragments composed by few residues to complete domains or proteins, depending on available information on PPIs in each specific case.
blastPDB output: specific residue-residue contacts inferred by blastPDB.
The output is complemented with sequence feature annotations described in Uniprot database and matches with PFAM domains, which could help the user to easily identify or discard regions of interest for the design of their experiments.

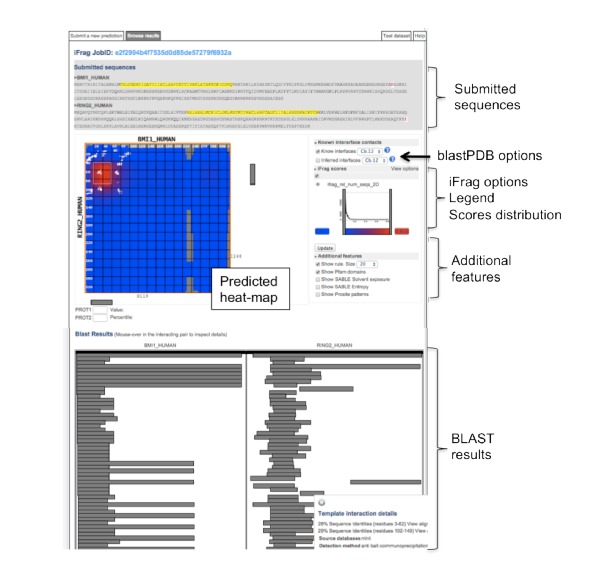
The results page is divided in three sections: 1) Submitted sequences; 2) Heat-map prediction and options; and 3) BLAST results. The session shows the iFrag heat-map prediction for the interaction between RING2_HUMAN and BMI_HUMAN. White spots indicate the real contacts between the two proteins. In the heat-map, blue indicates low iFrag scores while red indicates high scores. The heat-map is interactive: if the user navigates over the heat-map, the corresponding protein sequence positions are highlighted. BLAST results section is also interactive: the user can check the template interaction and the sequence alignments.


