SINGLE
TEMPLATE PROTEIN MODELING
Acetate
kinase from Rhizobium meliloti
INTRODUCTION
AIMS
OF THE STUDY
MATERIALS
AND METHODS
Sequences
(swissprot entry)
Programs
RESULTS
Template
selection
Resulting
models
Model
selection
Model
optimization
DISCUSSION
CONCLUSIONS
FURTHER
STUDIES
REFERENCES
ACKNOWLEDGEMENTS
PEOPLE
INTRODUCTION
Acetate kinases are a protein family mainly found
in microorganisms whose enzymatic function consists in the conversion of
organic matter to CO2 and CH4 (by the conversion of acetate to acetyl phosphate
in the presence of ATP and a divalent cation). Structurally, after the
SCOP classification, they belong to the a/b Class, and to the ASKHA Superfamily
(acetate and sugar kinases/Hsc70/actin), whose members have a conserved
structural "bbbababa" core and the strange epsilon conformation on the
Ala 330 (Phi-angle=75.4º, Psi-angle=175.3º), that initiates a
turn of a helix in all the members of the Superfamily.
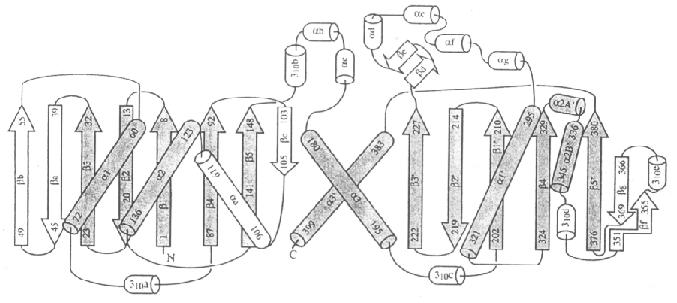
Fig.1
Topologic
diagram of the template. The mentioned "bbbababa" core is represented
in dark grey; the remaining secondary structures (subdomains) are
insertions between particular elements of the beta sheet, typical of each
member of the Superfamily
The structure of the acetate kinase from Rhizobium
meliloti (P58382) has not been obtained
experimentally yet. Its modeling has been based on a single template, the
acetate kinase of Methanosarcina thermophila
(1g99),
whose structure was obtained in 2000 at 2.50 A (Buss et al., 2001).
Although
the molecules are dimers, both monomers are identical (100% homology, see
dimer.aln),
we have used one monomer of the template (Chain A) . Therefore, all the
rasmol views below will account for one monomer only (each monomer consisting
of a central beta sheet surrounded by alpha helices). Next view of the
template shows the complete molecule in the so called "bird" conformation:
the body of the bird is composed by the C-terminal domains (7 stranded
beta sheet and 11 helices, for each monomer), and the wings by the N-terminal
domains (8 stranded beta sheet and 8 helices, for each monomer). The ATP
binds in the cleft between the two domains, without forming any hidrogen
bonds with the protein (which explains the lack of specificity of the enzyme
for a particular nucleotide triphosphate, as the phosphoryl donnor). The
cleft closes and brings the two catalytic residues toghether (Glu384: one
in each side of the molecule), so that they achieve the active site and
participate directly in the phosphorilation.
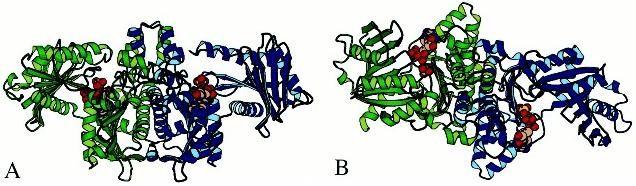
Fig.2
Frontal
and side views of the template's bird conformation (A and B, respectively)
Top
AIMS
OF THE STUDY
Comparing the differences of modeling by primary sequence
homology and by prediction of secondary structure.
Top
MATERIALS
AND METHODS
Sequences
(swissprot entry)
|
P58382
|
Acetate
kinase from Rhizobium meliloti |
|
P38502 |
Acetate
kinase from Methanosarcina thermophila |
|
Q59331 |
Acetate
kinase from Clostridium thermosaccharolyticum |
|
P37877 |
Acetate
kinase from Bacillus subtilis |
|
P74879 |
Propionate
kinase from Salmonella typhimurium |
|
P77845 |
Acetate
kinase from Corynebacterium glutamicum |
|
P11868 |
Propionate
kinase from Escherichia coli |
|
Q9X4M1 |
Acetate
kinase from Lactobacillus sakei |
|
Q05619 |
Butyrate
kinase Clostridium beijerinckii |
Programs
HMMER
CLUSTALW
TOPITS
MODELLER
RASMOL
PROSAII
PROCHECK
GRUMOS
ARCHTYPE
Top
RESULTS
Template
selection
The different strategies we use gives us the same
and single template (1g99), with an E-value ranging from e-218 to
e-110:
-
Search
in the PDB database (through "hmmsearch").
-
Alignment
of the markov model with the own problem sequence (through "hmmalign")-
this will be the startpoint for a new psiblast in the PDB database.
-
Psi-blast
in the PDB database
Since there are no templates other than 1g99 the only
alignment we can put into the Modeller
program is the one with the sequence of the template (taken from the PDBfile)
and the problem sequence. Another approach is to use the Topits
server to make a prediction of secondary structure of the problem sequence
based on the information in the PDBfile of the template (see the files
containing these procedures Alin.aln and topits.html).
We note that the server extracts the template sequence from Swissprot and
not from the PDBfile; we want to preserve the topits alignment and use
the PDB sequence, otherwise the Modeller wouldn't recognize the input file.
That's why we simply align both template sequences (swissprot and PDB template-sequence)
and the gaps contained in the resulting file have to be added to the normal
clustalw alignment (Alin.aln) which will also contain the only gap that
returns topits (final.clw). Some gaps have to be
changed in the clustalw alignment between the template and the problem
sequence: those that appear at the end of an alfa helix (localized thanks
to the topits prediction); we simply move them a bit forward to avoid cutting
the helix, which would rise the general energetic profile, since these
secondary structure stabilizes the final general tertiary structure (final.clw
compared to pdb_problema.aln).
Resulting
models
After having changed the clustalw format to the peer
format (alin.pir and final.pir)
and generated the respective .top input files (alin.top
and topits.top), we start running the Modeller
program.
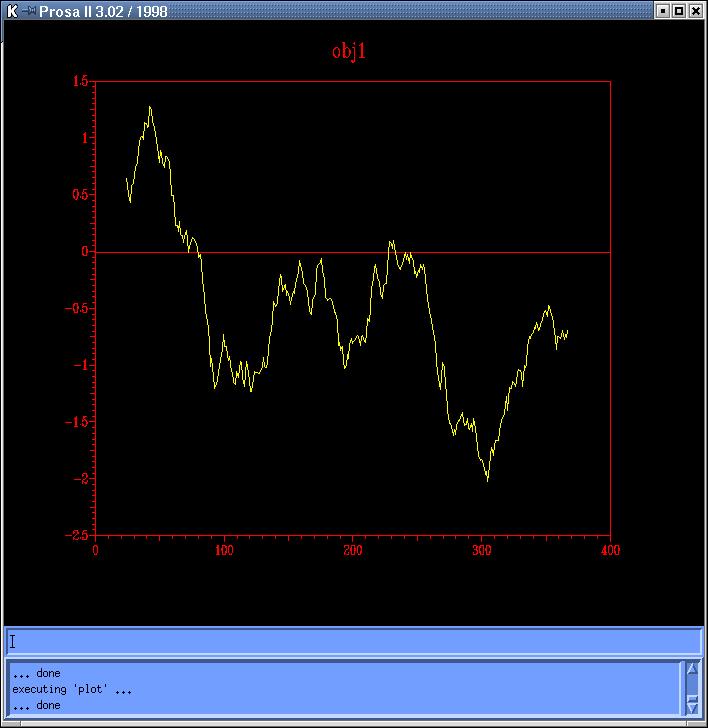
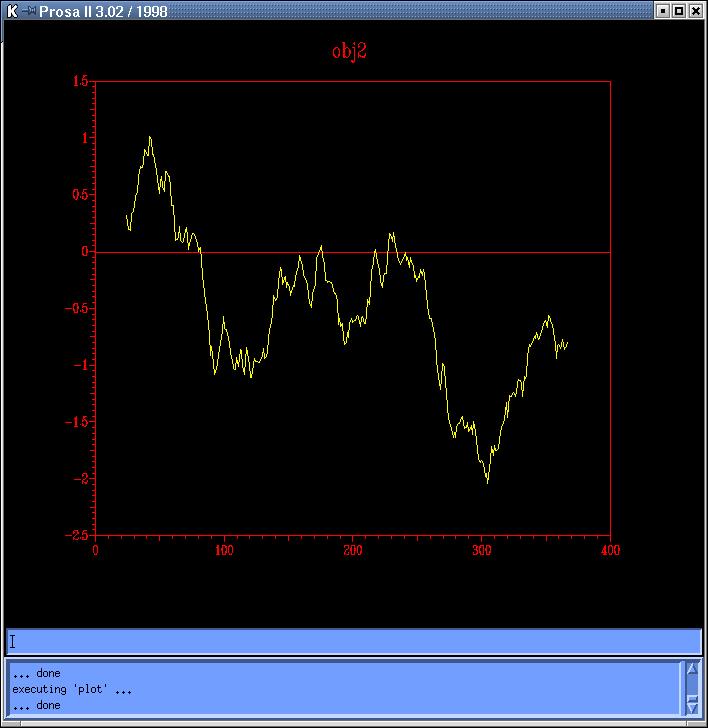
We obtain four models (obj1,
obj2,
obj3
and obj4) and the respective Rasmol
views are:

Figs.3-6
Rasmol views of the objects 1,2,3 and 4, respectively
Fig.7
Rasmol
view of the common superposed structure of the four previous models
Model
selection
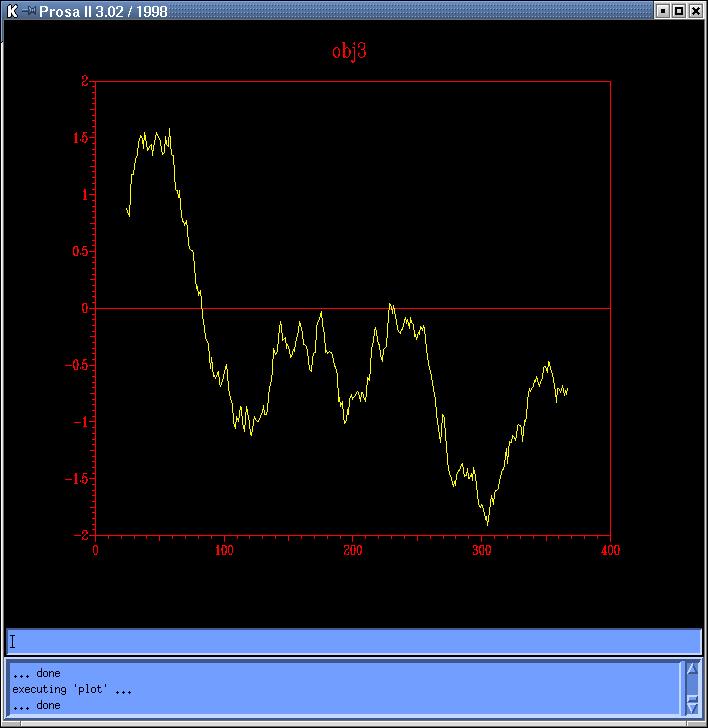
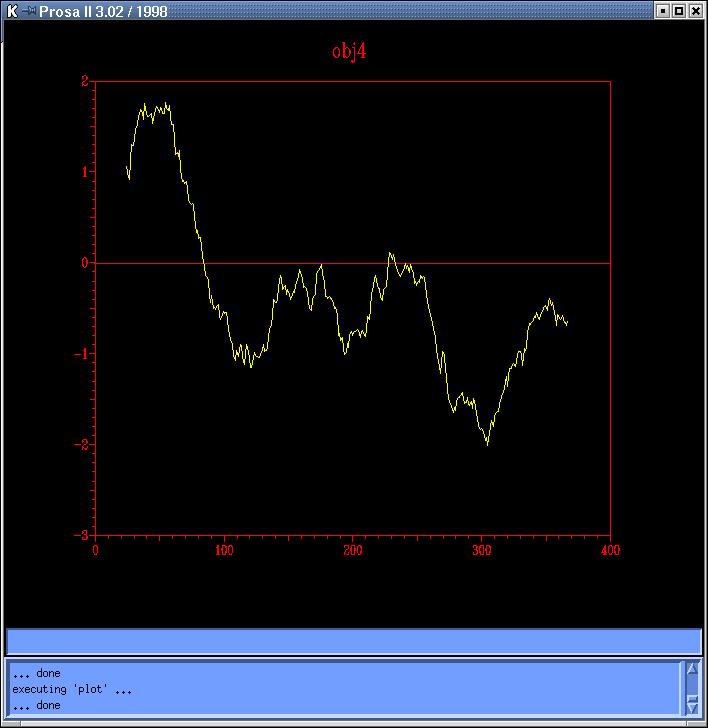
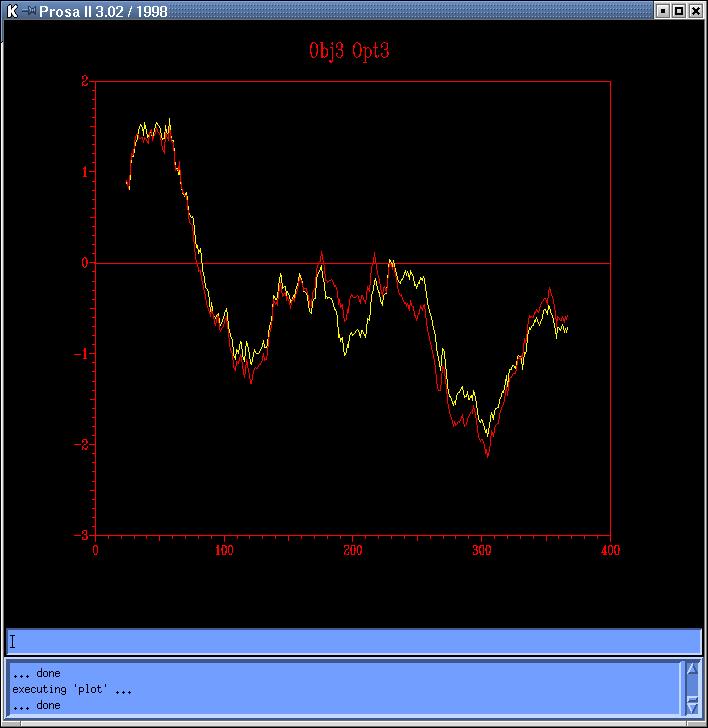
The
energy profiles of each model calculated by Prosa
II (combined energy plots) shows at least 3 peaks of positive
energy, from which the most important is the one at 80 residues, and the
other two are at 230 and 250 residues, approximately (Prosa1,
Prosa2,
Prosa3
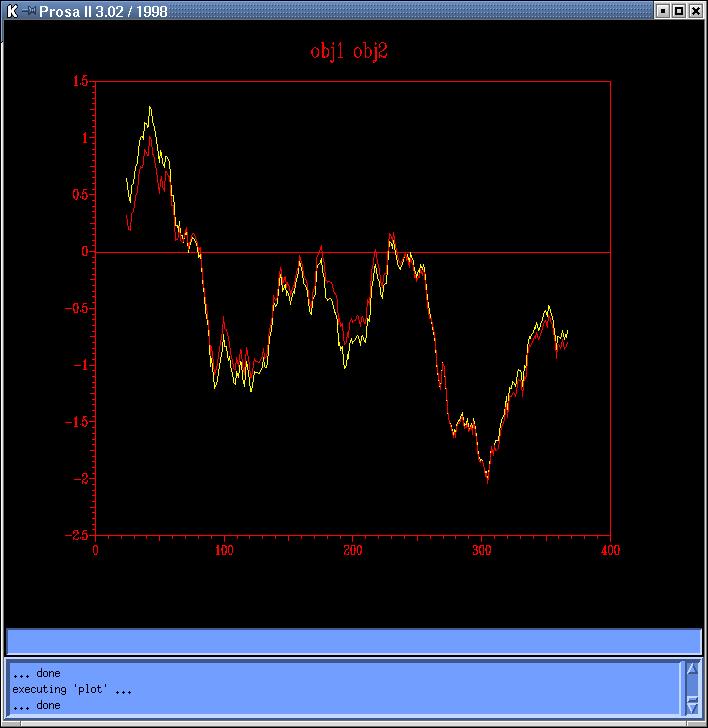
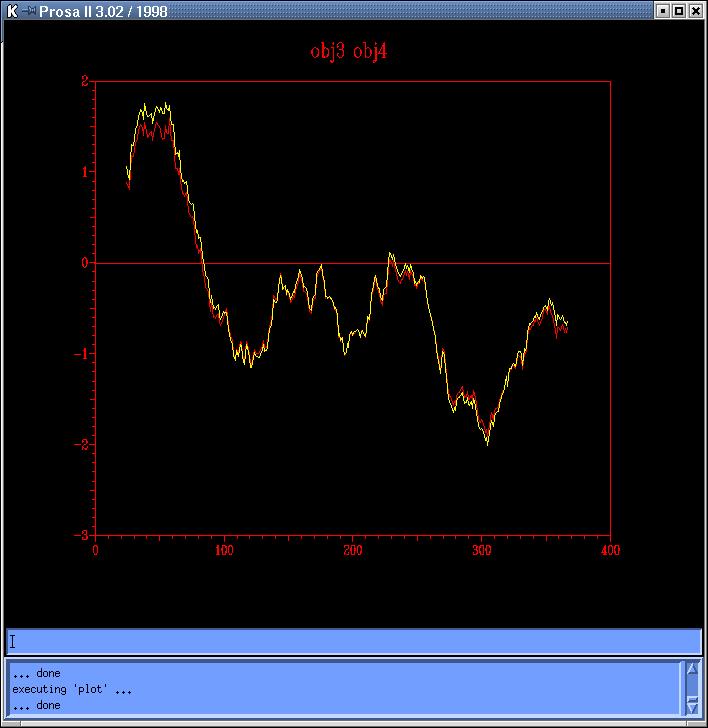
and Prosa4). Comparing both sequence based models
(obj12prosa.jpg, code: obj1-yellow,
obj2-red) and both topits models (obj34prosa.jpg,
code: obj3-yellow, obj4-red)
we decide to use those with lowest energy profiles (obj2 y obj3) to continue
with the optimization (in red in Prosa II plots). The Ramachandran
plots (from the Procheck analysis, at 2.5A) show an average
percentage of disallowed regions of 0.6% for both models, obj2
and obj3. (0.0% for the template 1g99A.sum).
The
second and the third models have the same number of bad contacts (3) in
the
Procheck output (P58382.sum,
predict_h3170.sum),
(1 bad contact in the template, 1g99A.sum).
From
these two models (obj2 and obj3), the first one has the most optimized
energies; however, we will try to optimize the peaks of both of them, by
using three different strategies:
Grumos,
Archtype
and Molecular Dynamics.
Model
optimization
The
Grumos
optimization (previous arrangement of the model, without any disulfide
bridge, water-free system, Steepest Descent method of energy analysis,
10 optimizations -one every 1000 steps- without shake, interactions between
groups) improves none of the two selected models, substantially.
The
peaks still appear in the common ProsaII plot (Grumos2,
code:
Obj2-yellow, Opt2-red;
Grumos3,
code:
Obj3-yellow, Opt3-red); although
there is a small descent in the two second peak in the sequence based models
optimization, but the first terrible one, is even increased.
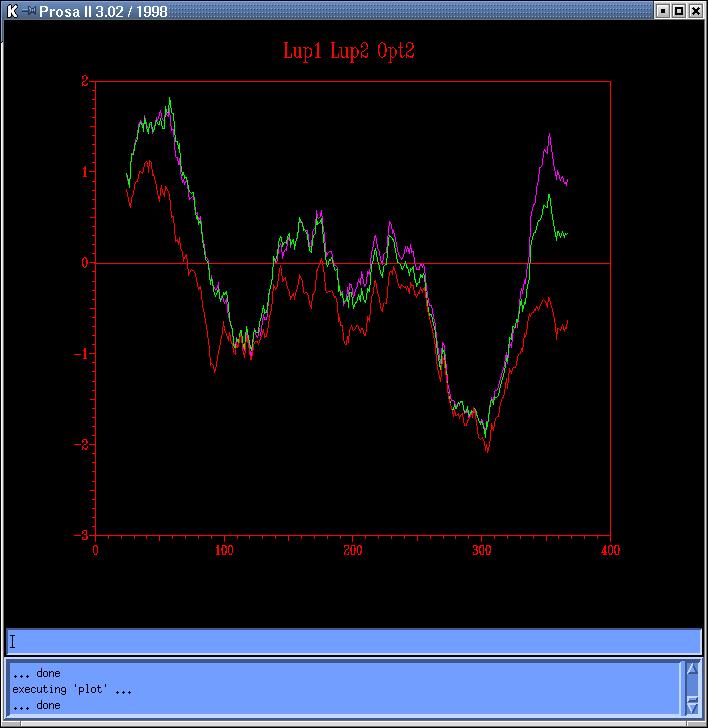
We
cannot use Archtype to minimize the
energy of the first 100 residues, as the loop found in this region is 12
aa long; we will wait until we run the Molecular Dynamic to see if there
is something to do with it. We try anyway with the mentioned program but
the results are hopeless: the protein presents 5 loops at the peaks sites,
from which just four of them have lengths able to be analyzed through the
Archtype (less than 9 residues long). Starting with the fourth loop (parameters),
and lowering the cutoff from 60 to 45 (which is rather
inefficient) the program gives a list of templates, from which the
best is1mro_B (PDBentry), cluster_k, with a score
of 100, but after having pasted the loop region to the normal "Template-ProblemSequence
alignment", (and subsequent modifications to run the Modeller program),
it raises the general energy profile (plot, code:
Lup-magenta,
Lup2-green, Opt2-red). Since the obtained plot doesn't solve the energetic
problem, and given the low cutoff used, we decide not to follow with this
strategy.
! Since
this is a modeling based on the practical courses of the subject Structural
Biology, our knowledge has almost reached its limits.
The last resource in the model optimization is to
run de Molecular Dynamic
analysis with the option in the Grumos program (Temp. by default,
without periodicity, rotation 50, 10ps trajectory time, 10 output
files, 100ps as total dynamic time). We do the same for both models (based
on sequence and based on secondary structure prediction). The 10 resulting
output files, superposed with XAM, show the fragment with the worst energetic
profile (1-100 aa) in a rigid conformational state in both models (green),
so at the temperature used in the dynamic (278 K) the secondary structure
in this region doesn't move. The second studied region (230-255 aa) appears
to be very flexible in the first dynamic (Dynamics2-magenta), which
comes from a quite successful Energy Optimization. Surprisingly, the other
dynamic, which wasn't successful at all in energy optimization, doesn't
seem to be as flexible as in the first case. (Dynamics2;
Dynamics3,
code: 1-100 aa in green and 230-255 aa in magenta).
Top
DISCUSSION
Because the most important of a protein for this to
be functional is its catalytic center we are going to follow the analysis
by comparison of the important residues of the template with those found
in the model, which is going to be definitely the obj2, the sequence based
model.
According to the article of reference (Buss
et al., 2001), the template presents 4 important
regions:
|
Region
|
Sub-region
|
Involved
Aminoacids
|
Color
|
|
ADP binding region
|
Adenine binding (hydrophobic
pocket)
|
A285, I332, I339,
D283
|
Orange
|
| |
Ribose binding
|
F284
|
Green
|
| |
alpha-phosphate binding
|
G331
|
Pink
|
| |
beta-phosphate binding
|
H208, S209, G210
|
Cyan
|
|
Substrate binding
|
Acetyl phosphate
binding
|
R91, H123,
H180 (phosphate moiety)
|
Brown
|
| |
Acetate binding
|
V93, F179, M228 (methyl
group) P232, R241
|
Yellow
|
|
Cation binding (Mg2+)
|
|
D148
|
Magenta
|
|
Phosphorylation site
|
|
E384
|
Red
|
The
comparison of both structures (the template and the model) shows a conserved
catalytic site, with some modifications in concrete residues, due to a
shift between the sequences in the alignment:
-
In Adenine binding site: A285
-> A283, I332 -> I327, I339 -> I334 and D283 -> D281
-
In Ribose binding site: F284
-> M282
-
In alpha-phosphate binding site:
no
changes
-
In beta-phosphate binding site:
H208
-> H206, N211 -> S209 and
G212 -> G210
-
In Acetyl phosphate binding
site: H180 -> H179
-
In Acetate binding site: F179
-> F178
-
Cation binding site: no changes
-
Phosphorylation site: E384
-> E377
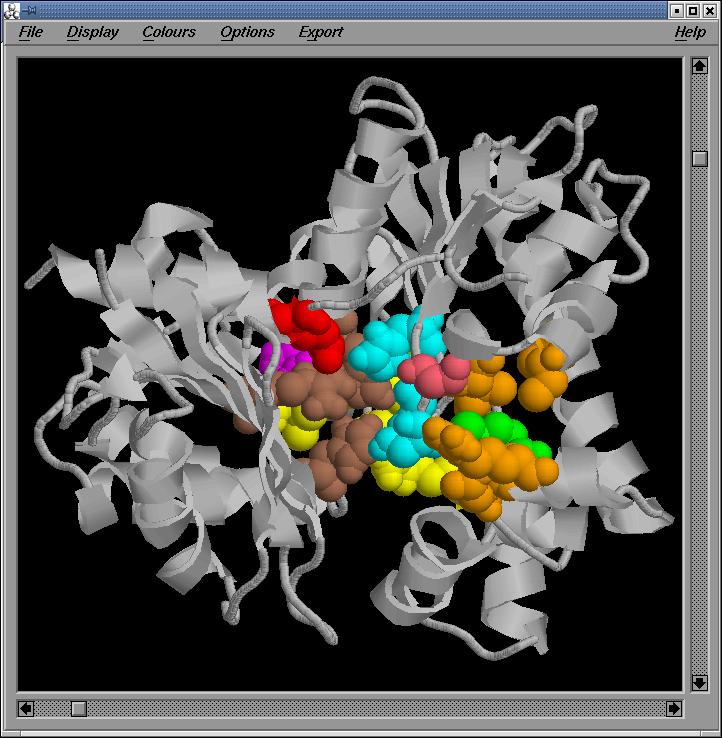
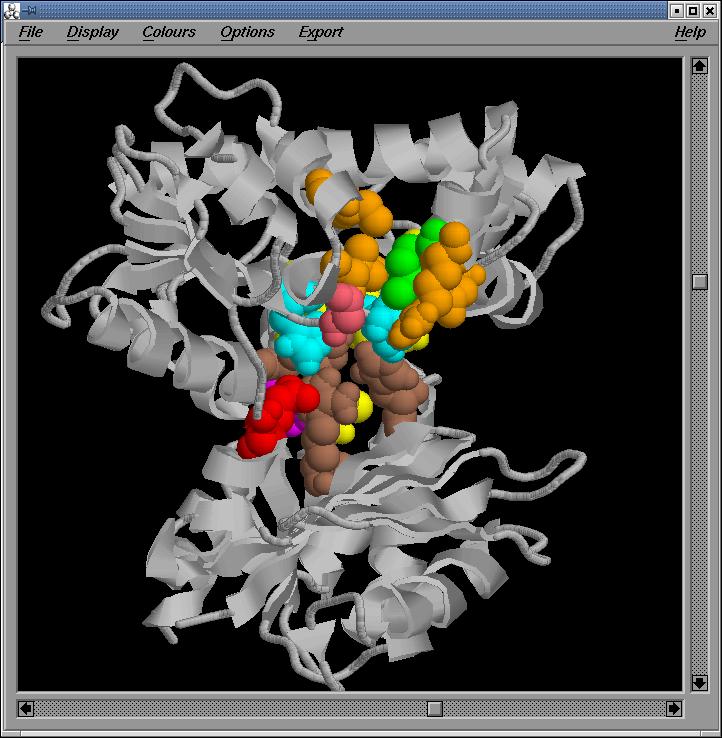

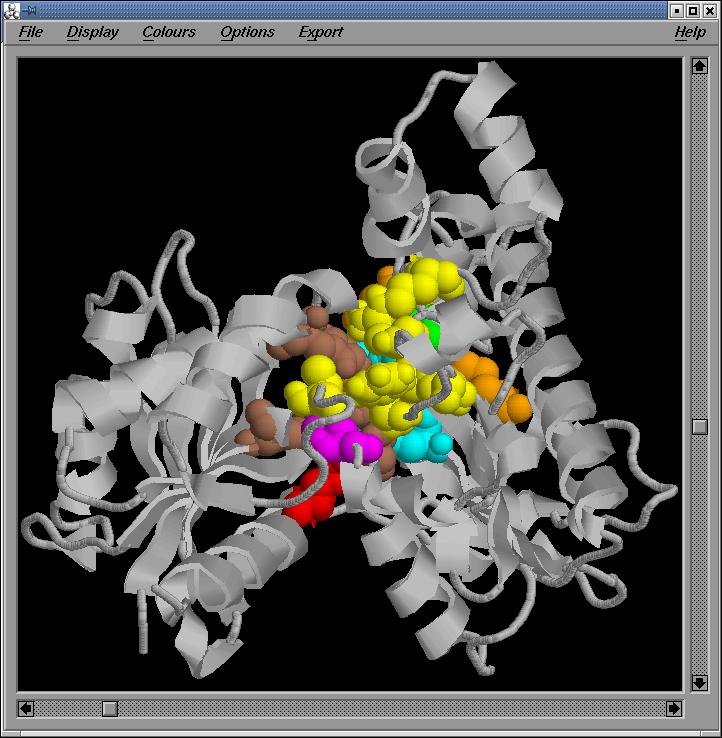
Fig.8-11
General,
two side and back Rasmol views of the active site in the optimized sequence
based model, respectively
We
observe that the important regions are conserved in the optimized sequenced
based model.
The
next important feature to check in our model is the strange epsilon conformation
in residue 325 (the Alanine found in position 330 in the template). Another
superposition between these two structures gives us the confirmation of
these absolutely conserved conformation among all the ASKHA Superfamily
members.
Fig.12
Rasmol
view of the conserved epsilon conformation in residues 330 (Template, in
blue) and 325 (Model, in green); both are Alanines
Top
CONCLUSIONS
None
of the strategies used is able to give a perfect model of the problem sequence,
in terms of the energetic profile. The topits based model should have been
the best, since it introduces structural information from the beginning,
but we realise that small changes in the sequence, in non-functional regions
of the protein, can greatly influence the end result. Nevertheless, given
the high homology between both sequences (92%), the important features
of the protein are well modeled (the ownership to the superfamily and the
functional active site).
Top
FURTHER
STUDIES
Despite
the low cutoff, the remaining loops could be further optimized with the
Archtype program.
The temperature of the Dynamic
analysis could be raised to allow some problematic regions to move and
adopt a more stable conformational state.
There must be other programs
(¿?) or possibilities to achieve a better model, but our is a limited
assignment.
Another
possible template has been determined recently by theoretical methods;
the PDBfile has been released in the Database today, the 12th June 2002,
by the group of R. Sagajkar and R. Ramchandra (1LP2,
Acetate Kinase of Pasteurella Multocida); a modeling including this second
template could be of a great help. Unluckily, the article hasn't been published
yet.
Top
REFERENCES
Buss,
Kathryn A. and Cooper, David R. 2001 Urkinase: Structure of Acetate
Kinase, a Member of the ASKHA Superfamily of Phosphotransferases. Journal
of Bacteriology 183: 680-686
TOPITS
server
ARCHTYPE
server
Top
ACKNOWLEDGEMENTS
To our devoted teachers in Structural Biology, specially
to Nuria Centeno, for her patience and encouragement.
Top
PEOPLE
Isabel
Lorenzo Sánchez
Dominique
Monferrer Ventura
Ángel
Núñez Pagán
Top
Barcelona,
12th June 2002